Skip to content
Jason A. Heppler

Microblog

Microblog

Using Omekadd and Bash Together

I found some time this weekend to play around with Caleb McDaniel’s Python script Omekadd, which uses the Omeka API to change properly formatted YAML documents into JSON strings to post as Omeka items. In the short amount of time I’ve used it, I’ve already found Omekadd to be a big time-saver for me. It’s faster for me to jump into vim or Sublime, hit my TextExpander snippet to autofill some of the basic YAML information, add the details, description, and transcription if necessary, and finally jump back to the command line to run the script and send everything to the server.

My normal routine for Omeka had been to use the Dropbox plugin to throw all of my PDFs, images, and so on onto my server, then use Dropbox’s file selection and fill out all the relevant information using Omeka’s web interface. But the process was a bit clunky for me – I had to jump back and forth frequently between the browser, the original source to look up details, and click around the web interface to fill out all the appropriate information. The process was time consuming, made all the more real after a research trip this weekend where I came home with a few hundred photographs I needed to start processing. Using the web interface among hundreds of documents would’ve required a huge investment of time.

Omekadd seems to resolve much of this for me. Rather than the web interface, I popped open Sublime Text alongside my PDF images so I could easily reference the primary source. Using TextExpander, I type ;omekadd and, ding, the template is ready for me to add information. My ;omekadd template looks like this:

---
Title: 
Source: 
Publisher: Published here by Jason A. Heppler.
Date: 
Rights: This item is published solely for personal research and nonprofit educational use under the terms of fair use. No copyright in the item is asserted or implied by its publication here.
Format: 
Language: English
Type: Text
Description: |
    markdown> 
Text: |
    markdown> 

While this method of working with Omeka sped up my use of the platform, I felt I could squeeze a bit more efficiency out of my use case. Ideally, my workflow would be to finish processing a batch of YAML documents before I have to jump over to the command line and call up the script. To resolve this issue, I wrote up a very basic bash script that gets the job done.

The script is only four lines of code, and comes with a few caveats:

  1. If you’re iterating through a lot of files all at once, be alert of any upload limits you might hit with your host. I don’t know that this will really be a problem, but it’s worth being aware.

  2. The script is tailored to my specific use case and serves more as a proof of concept, so will probably need some editing if you choose to use it. For example, the script assumes that the YAML file and the PDF share the same filename (e.g., item0001.yaml and item0001.pdf belong together). You may not wish to rename files this way, or you may be working with other file formats instead of PDF.

  3. Don’t forget to adjust the path to Omekadd.

  4. The regex looks for a filename that’s exactly as long as the filenames I am using (in this case, e.g., item0001, item0002, etc.). If you want to make sure everything is working before you start calling up Omekadd, just comment out the upload line and echo some results first to make sure you’re getting what you want.

  5. The script doesn’t seek to very robust. There’s no error checking, no special switches, and makes no guarantee that your data is safe. I haven’t run into any problems yet, but you may. Suggestions? Problems? Questions? Let me know!

And now, to the script:

#!/bin/bash
 
# Written by Jason A. Heppler
# Iterate through the base directory, find all .yaml files and .pdf files, and
# upload these files to Omeka. For use with Caleb McDaniel's Omekadd Python 
# script: https://github.com/wcaleb/omekadd
#
# Last Modified: 2013-11-17
 
 # The script assumes the .yaml and .pdf share the same filename, so the two can
 # be matched together for upload (e.g., item001.yaml belongs with item001.pdf).
 
for i in *.yaml ; do
 
  # the pdf file will have the same filename as the yaml file
  filename_pdf=${i/%?????/}.pdf
 
  # upload to Omeka
  python /Users/jheppler/git/omekadd/omekadd.py $i -u $filename_pdf
 
done

The script iterates through a directory of YAML documents, finds the PDF with the matching filename, and uploads all the information to my Omeka archive.

Simple, and so far for my purposes, it gets the job done.
Programming

Converting Plain Text to PDF with Bash

I’ve written in the past about my love for Markdown, especially in its relation to scholarly work. Some people have written whole books with plain text, and my dissertation is being written entirely in Markdown. But I often need the plain text converted to, well, a more commonly-used file format. My system ties together Markdown and Pandoc for converting plain text into PDF or .docx for distribution.

But I wanted a faster way to convert these files without having to remember the Pandoc string I wanted for controlling the layout, bibliography style, and output location. So, I wrote a bash script to output the files for me. The script takes in the file ($ ./pub.sh chapter.md), uses the template, bibliography, and bibliographic style I’d like for the document, and outputs the generated files in both PDF and .docx.

#!/bin/bash
# pub.sh
# Take in a Markdown file and convert to PDF and .docx with Pandoc
# Usage: ./pub.sh file.md

# Version control information
echo "Updating revision information"
sh vc

file="$1"

echo "Generating PDF files"
pandoc $file \
	--bibliography=/Users/jheppler/Dropbox/research/bib/master.bib \
	--template xelatex.template \
	--csl=chicago-fullnote-bibliography-no-ibid.csl \
	--latex-engine=xelatex \
	-o drafts/$file.pdf

echo "Generating Word files"
pandoc $file \
	--bibliography=/Users/jheppler/Dropbox/research/bib/master.bib \
	--csl=chicago-fullnote-bibliography-no-ibid.csl \
	-o drafts/$file.docx

# hide the log
echo "Hiding log files"
mv "*.log" ".logged"

# delete all the junk files
echo "Removing temp files"
find . -name "*.log" -exec rm -rf {} \;
find . -name "*.aux" -exec rm -rf {} \;
find . -name "*.toc" -exec rm -rf {} \;
find . -name "*.blg" -exec rm -rf {} \;
find . -name "*.bbl" -exec rm -rf {} \;
find . -name "*.out" -exec rm -rf {} \;
find . -name "*.brf" -exec rm -rf {} \;
find . -name "*.tex-e" -exec rm -rf {} \;
find . -name "*.lof" -exec rm -rf {} \;
find . -name "*.lot" -exec rm -rf {} \;
find . -name "*.loa" -exec rm -rf {} \;
find . -name "*.bcf" -exec rm -rf {} \;
find . -name "*.gz" -exec rm -rf {} \;
find . -name "*.run.xml" -exec rm -rf {} \;

Programming

Amazon Pairs Print and Digital Books

Nick Wingfield on Amazon’s MatchBook program:

One benefit of MatchBook is that Amazon will let its customers buy Kindle editions of books that they purchased in print as far back as 1995, the year Amazon opened for business. The discounted Kindle edition prices apply to book purchases made in the future on Amazon too.

In an interview, Russ Grandinetti, vice president of Kindle Content, said one of the most common requests Amazon receives from its Kindle customers is a way to build parallel print and digital book libraries, which hasn’t been practical at full retail prices. He said many print lovers will enjoy Kindle features like text searching of books, especially reference books. Kindle fans, meanwhile, still want print editions of books as souvenirs and art objects.

Tech life

Using Editorial and Bibkeys Together

A few days go, Editorial for iPad was released. Created by Pythonista developer Ole Zorn, Editorial is the latest markdown editor for the iPad and, quite frankly, is the best one available right now. There’s been some excellent reviews of Editorial, notably from Federico Viticci and Gabe Weatherhead that are well worth reading.

Citation workflow

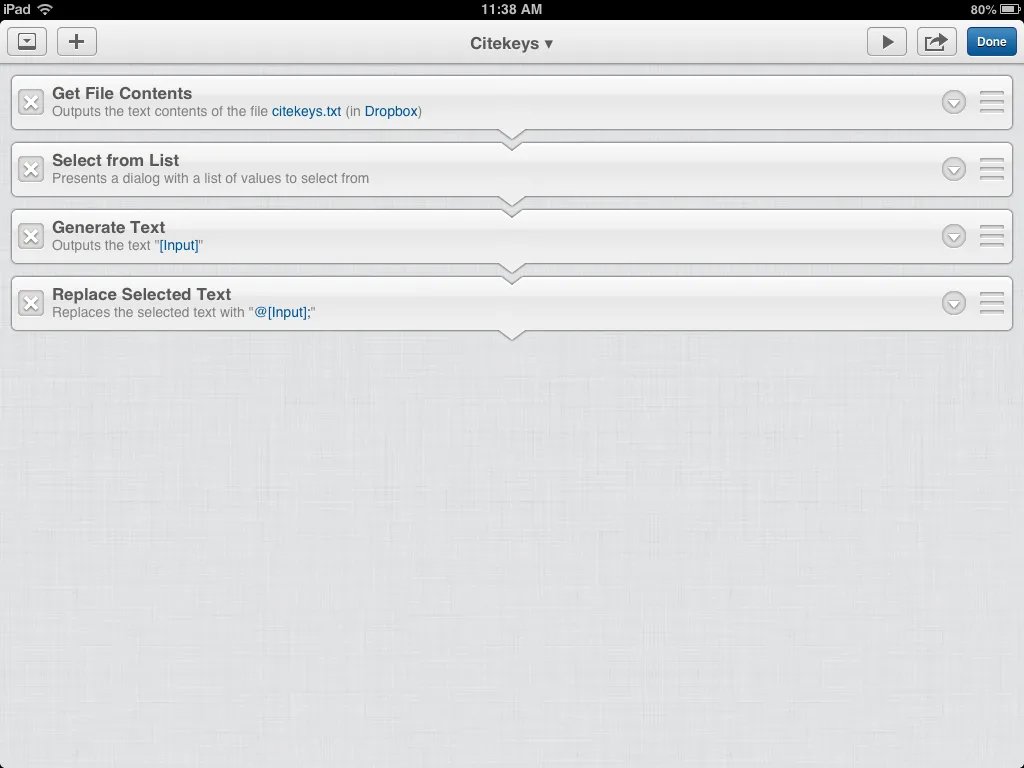
I’ve spent the last week exclusively writing with Editorial and have been blown away by its features, especially the ability to build Workflows. Workflows are similar to Automator on Mac and allow you to construct ways to automate tasks (which includes running Python scripts).1 I do all of my writing in Markdown, including my dissertation, and I wanted a way to access my citations, which I maintain in a BibTeX database for citing in vim and processing with Pandoc. To call up citations in vim, I use Lincoln Mullen’s Bibkeys and his recommendation for vim dictionary completion. But for doing all of my writing in Editorial, I needed a different system. With Workflows, this turned out to be ridiculously easy.

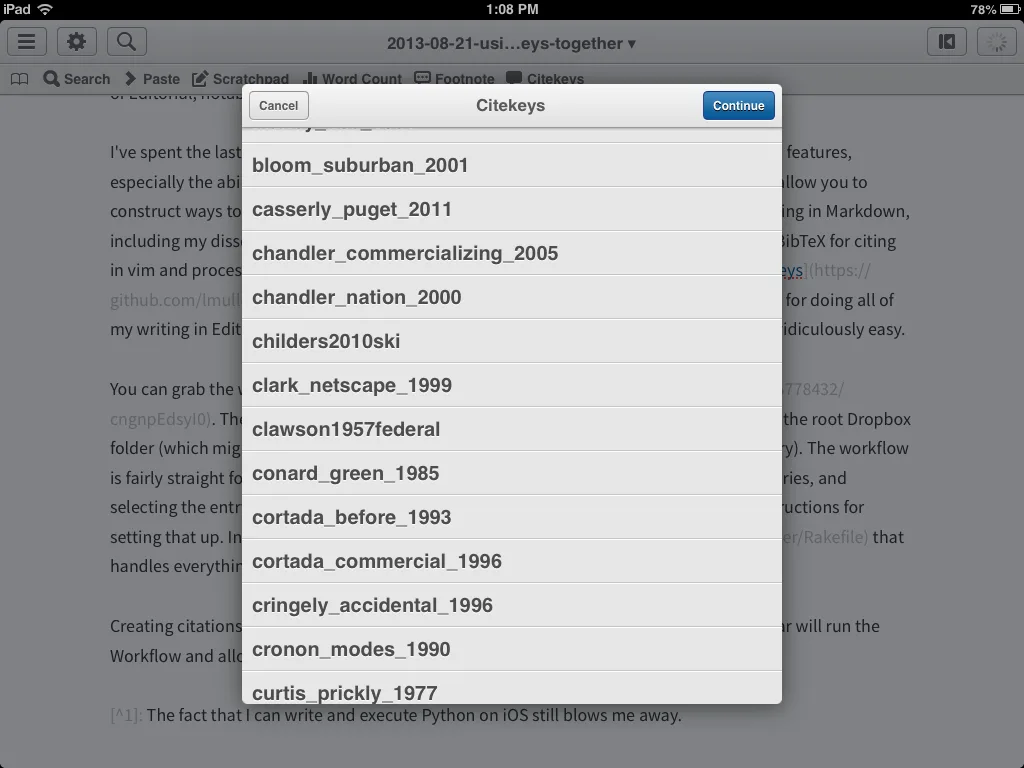
You can grab the workflow here. The one downfall at the moment is the citekeys.txt file needs to be in the root Dropbox folder (which might only be a problem for me since I keep my bibliography files in their own directory). The workflow is fairly straight forward and works by locating the text file, displaying a list of the file’s entries, and selecting the entry you want. The text file must already exist; you can follow Lincoln’s instructions for setting that up. In my case, I have a Rake file that handles everything for me.

Source list.

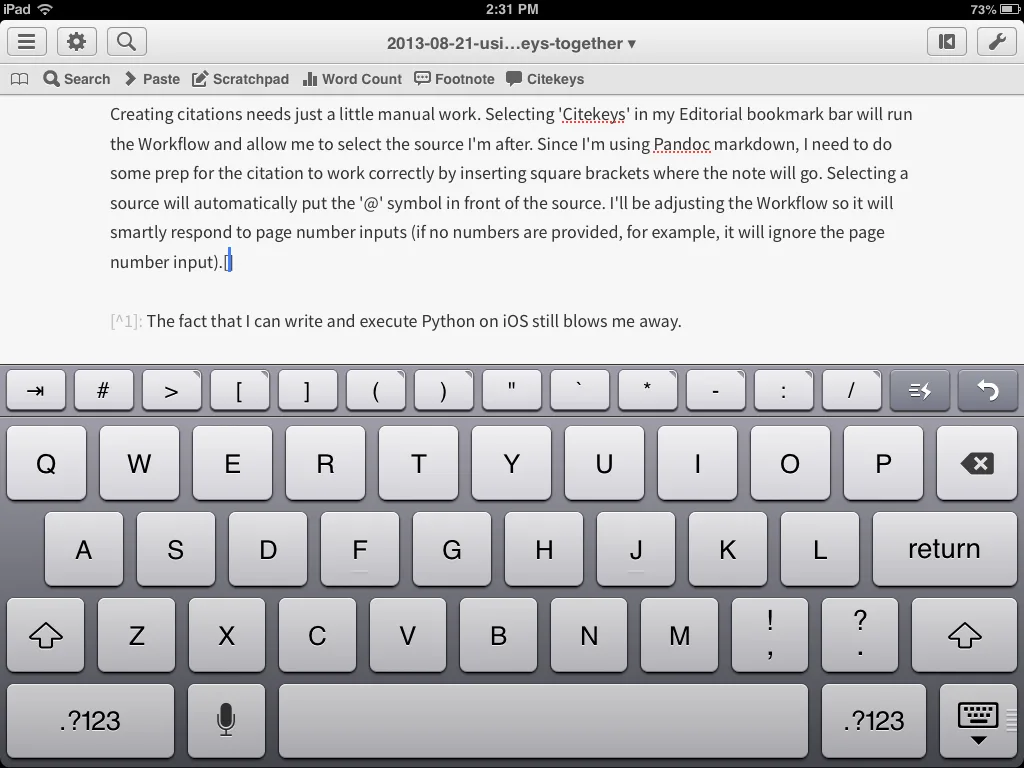
Creating citations needs just a little manual work. Selecting ‘Citekeys’ in my Editorial bookmark bar will run the Workflow and allow me to select the source I’m after. But since I’m using the citeproc built into Pandoc, I need to do some prep for the citation to work correctly by inserting square brackets where the note will go.

Inserting brackets.

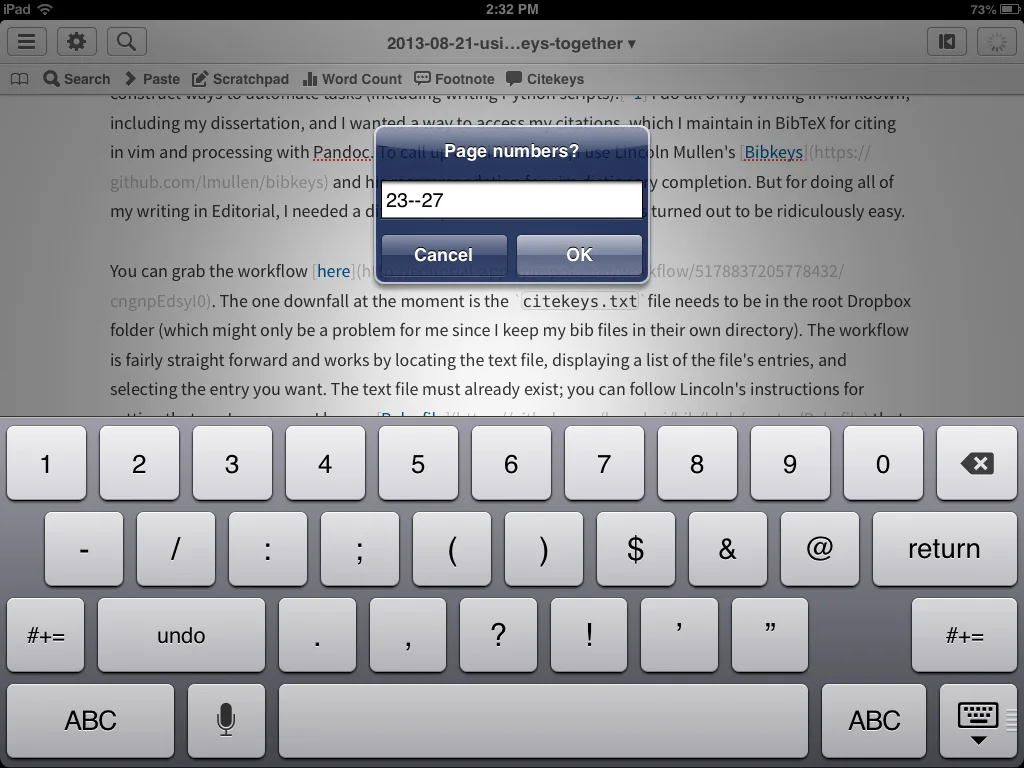
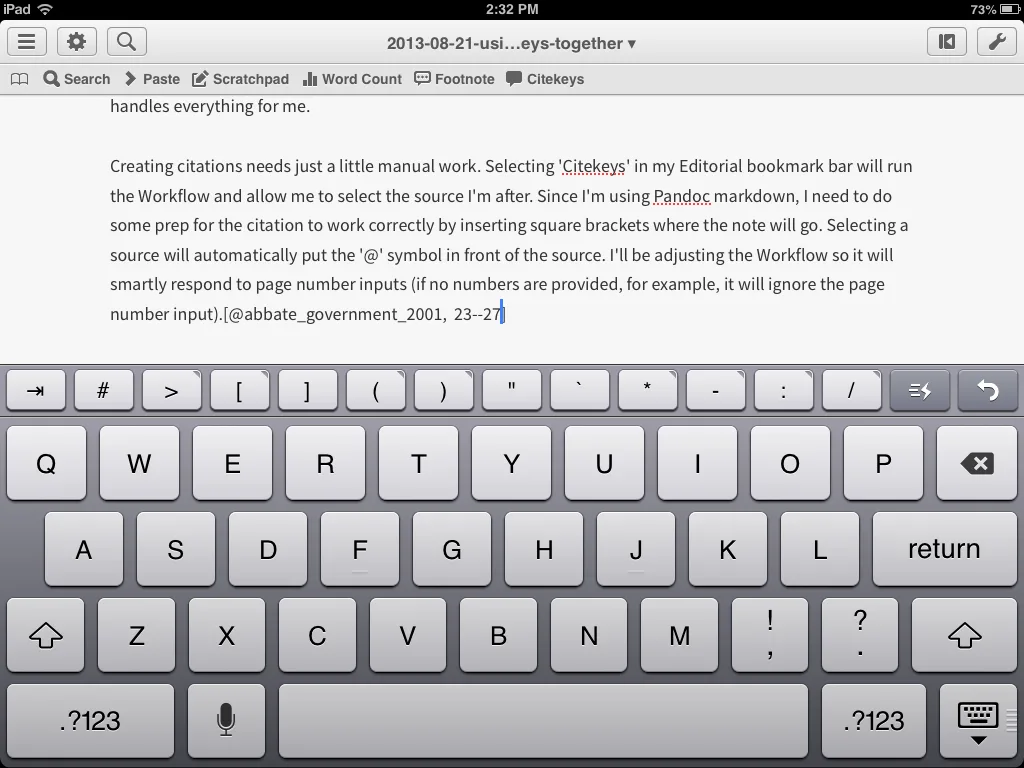
Selecting a source will automatically put the ‘@’ symbol in front of the source. I’ll be adjusting the Workflow so it will smartly respond to page number inputs (if no numbers are provided, for example, it will ignore the page number input).

Select pages.

Full citation.

If you make any modifications to the Workflow, please let me know. I’m sure there are better ways to handle some of this. For now, this works great for my needs.


  1. The fact that I can write and execute Python on iOS blows me away. That Pythonista and Editorial made it into the App Store is astounding. ↩︎

Plain text

Getting Started with D3

Over the last few months I have been learning D3.js, a Javascript library developed by Mike Bostock designed for creating data-driven visualizations and the manipulation of DOM elements. Since I’ve started picking it up, I’ve also had the opportunity to work with two undergraduate research assistants and, inexplicably, I convinced a graduate school friend to learn Javascript. In helping introduce others to D3, I noticed I had a consistent set of resources, sites, people, and tutorials I pointed them towards. So, I thought I would bring all of this together into an annotated blog post that will be useful not only for me to point people to, but other readers might also find helpful.

So, What Is D3?

D3 (Data Driven Documents) is a Javascript library that allows you to build amazing visualizations on the web, using the web standards established by HTML, CSS, and SVG. This means I have the option to port and scale visualizations around. Need a static visualization for a printed piece? We can resize the SVG without losing quality. Putting together an interactive visualization? We can scale up and down easily.

D3 binds arbitrary data to a Document Object Model (DOM) and apply transformations to the document. Some tasks might be fairly simple, such as creating a table from an array of numbers. Let’s say we have this table of data about high-risk property in places where western wildfires have the potential to do a lot of damage. We want to display the contents as an HTML table and can do so with something like this:

var columns = ["perc_high_risk_prop",
  "avg_val_low_risk",
  "avg_val_high_risk",
  "state",
  "very_high_risk_properties"];

d3.csv("/d/fire_prop.csv", function(error, data) {
    // Print the table by placing a `div` with `id` of `container` 
    // below, e.g. <div id="container"></div>
    var table = d3.select("#container").append("table"),
        thead = table.append("thead"),
        tbody = table.append("tbody");

    thead.append("tr")
    .selectAll("th")
      .data(columns)
    .enter()
      .append("th")
      .text(function(column) { return column; });

    var rows = tbody.selectAll("tr")
      .data(data)
    .enter()
      .append("tr");

    var cells = rows.selectAll("td")
      .data(function(row) {
          return columns.map(function(column) {
              return {column: column, value: row[column]};
          });
      })
    .enter()
      .append("td")
      .text(function(d) { return d.value; });
  });

The result is:

Neat, huh? We can also do much more complex visualizations. Say, for example, I wanted to use the above data to visualize the relationship between wildfires and the number of high risk properties for each state. In the case below, the size of the dot indicates the number properties considered high risk (the larger the circle, the higher the risk), while color indicates the percentage of properties that are high risk (determined by categorical coloring).

Source: CoreLogic and EcoWest

We achieve that with something like this:

var margin = {top: 20, right: 20, bottom: 30, left: 60},
    width = 620 - margin.left - margin.right,
    height = 450 - margin.top - margin.bottom;

var x = d3.scale.linear()
    .range([0, width]);

var y = d3.scale.linear()
    .range([height, 0]);

var color = d3.scale.category10();

var xAxis = d3.svg.axis()
    .scale(x)
    .orient("bottom");

var yAxis = d3.svg.axis()
    .scale(y)
    .orient("left");

var svg = d3.select("#fire_chart").append("svg")
    .attr("width", width + margin.left + margin.right)
    .attr("height", height + margin.top + margin.bottom)
  .append("g")
    .attr("transform", "translate(" + margin.left + "," + margin.top + ")");

d3.csv("/d/fire_prop.csv", function(error, data) {
  
  data.forEach(function(d) {
    d.avg_val_low_risk = +d.avg_val_low_risk;
    d.avg_val_high_risk = +d.avg_val_high_risk;
    d.very_high_risk_properties = +d.very_high_risk_properties;
  });

  x.domain(d3.extent(data, function(d) { return d.avg_val_low_risk; })).nice();
  y.domain(d3.extent(data, function(d) { return d.avg_val_high_risk; })).nice();

  svg.append("g")
      .attr("class", "x axis")
      .attr("transform", "translate(0," + height + ")")
      .call(xAxis)
    .append("text")
      .attr("class", "label")
      .attr("x", width)
      .attr("y", -6)
      .style("text-anchor", "end")
      .text("Avg. Low Risk Property");

  svg.append("g")
      .attr("class", "y axis")
      .call(yAxis)
    .append("text")
      .attr("class", "label")
      .attr("transform", "rotate(-90)")
      .attr("y", 6)
      .attr("dy", ".71em")
      .style("text-anchor", "end")
      .text("Avg. High Risk Property")

  svg.selectAll(".dot")
      .data(data)
    .enter().append("circle")
      .attr("class", "dot")
      // .attr("r", 3.5)
      .attr("cx", function(d) { return x(d.avg_val_low_risk); })
      .attr("cy", function(d) { return y(d.avg_val_high_risk); })
      .attr("r", function(d) {
        return Math.sqrt(parseInt(d.very_high_risk_properties) * 0.01);
      })
      .style("fill", function(d) { return color(d.perc_high_risk_prop); });

});

No Excel. No Flash. No static images. Nothing proprietary. Just good, clean HTML.

Useful Resources

I won’t be going through what all of this code does line by line. There’s a lot going on here, and going into detail about each element would result in a lengthy series of posts. Instead, want to point to several resources that I have found useful in learning D3 and that others might find useful as well.

Mike Bostock. Straight to the source. Mike is a computer science PhD student at Stanford University and now designs interactive graphics for the New York Times. Mike’s site has several examples for using D3, so spend some time perusing his site. Especially useful are:

Bl.ocks. Built by Mike, bl.ocks is designed as a simple code viewer. Using Github Gists, examples can be coded up and then displayed through bl.ocks. There are lots and lots of examples here, and a lot of the things I’ve learned probably started here looking at code. See, for example, Mike’s blocks.

D3js.org. The official documentation for D3.js. See especially the examples.

Scott Murray’s tutorials. Scott is an assistant professor of design at the University of San Francisco and author of Interactive Data Visualization for the Web. The book started out as the online tutorials and serves as an excellent introduction to D3. There’s also a free online version of the book.

Jason Davies. Jason is a consultant on data visualization and has many of examples on his site. He’s also a regular contributor to the core functionality provided by D3.

Stack Overflow D3 tag. Stack Overflow is your friend. Have a question about how to do something? Turn here first.

d3-js Google Group. Most questions should be directed to Stack Overflow, but the Google Group is fairly active and contains a lot of good information.

My D3 Pinboard bookmarks. My Pinboard tags for D3 are ever-growing, and contain a lot of tutorials, examples, and references. You might find some of these useful too.

I could go on and on, and you can probably expect to find much more (and more interesting) here on the site regarding D3 visualizations. But in the meantime, I hope these resources are useful for anyone just starting out.

Programming

Evernote Reminders

I’ve been taking another look at Evernote for organizing my non-research notes. I’ve been using a plaintext system for the last couple of years, using a combination of nvALT, Nebulous Notes for iOS, and Dropbox to keep everything in sync. But I’ve been impressed with Evernote’s latest redesigns, and their service seems to have gotten much better. Plus, if I ever get nervous about lock-in I can easily export Evernote notes as HTML and convert them to Markdown via Pandoc with ease.

One of the things that grabbed my attention was this post back in May that Evernote notes can now include reminders. Reminders will trigger iOS and Mac notifications when due. That could be quite handy. An alternative, plaintext based approach would be this nifty tool by Brett Terpstra called nvremind.

(Yes, I know, I said I wasn’t doing link posts anymore. But I do enjoy doing them, and might try them out again.)

Tech life·Plain text

Don't Forget Google Reader Goes Dark Monday

Dave Winer has a reminder that you should download your Google Reader subscriptions list before Monday.

I’ve moved on to the free tier of Newsblur for syncing items between devices (and the free tier offers one more advantage: keeping my RSS reading limit very small since it only allows up to 64 sites) and ReadKit for my MacBook (I use Newsblur’s iOS app on the mobile devices). I could probably give up syncing since the majority of my time is spent in front of my MacBook on a Wi-Fi connection. But in the case where I’d like access to my items, like riding Caltrain, I can access them on my phone.

The end of Google Reader is probably going to be a good thing. An area of technology that had gone a bit stale may be invigorated by people looking for new solutions.

Tech life

Newsletter

Occasional writing on the American West, agricultural history, and political culture.