As I do after every Western History Association meeting, I like to analyze the tweets on the days leading up to and during the conference. Things were a bit different this year, with a combination of a virtual pre-conference and the in-person conference a week later – so the tweets are a bit different this year.
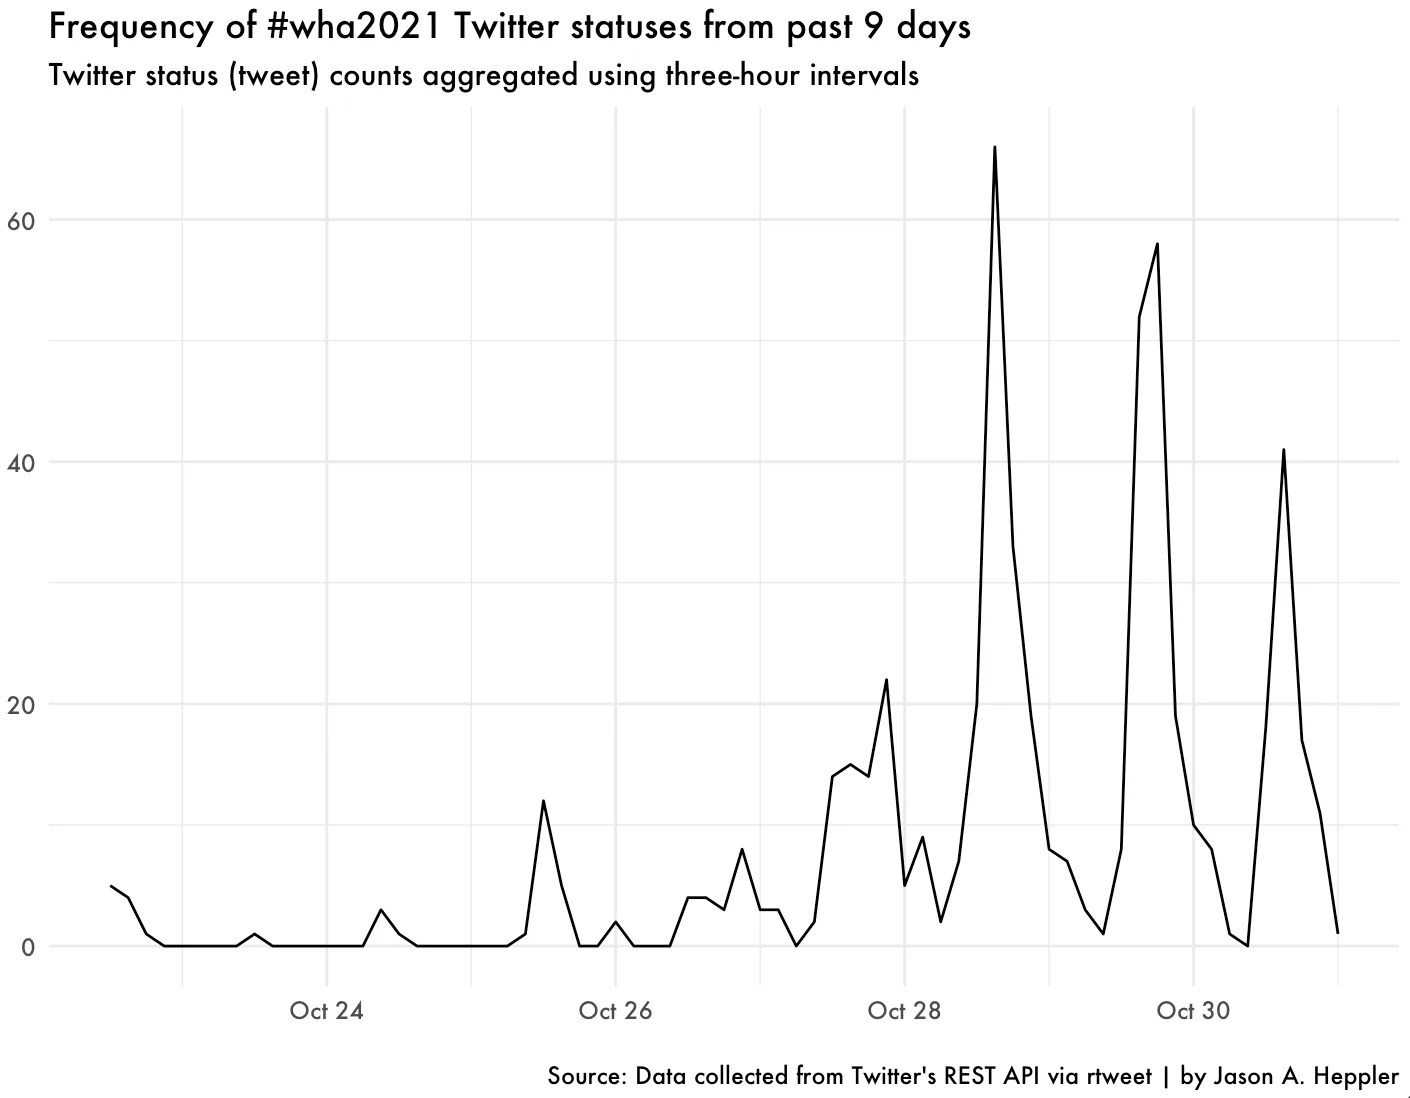
We can, as usual, see Twitter activity leading up to and during the conference itself with a predictable cyclical pattern.
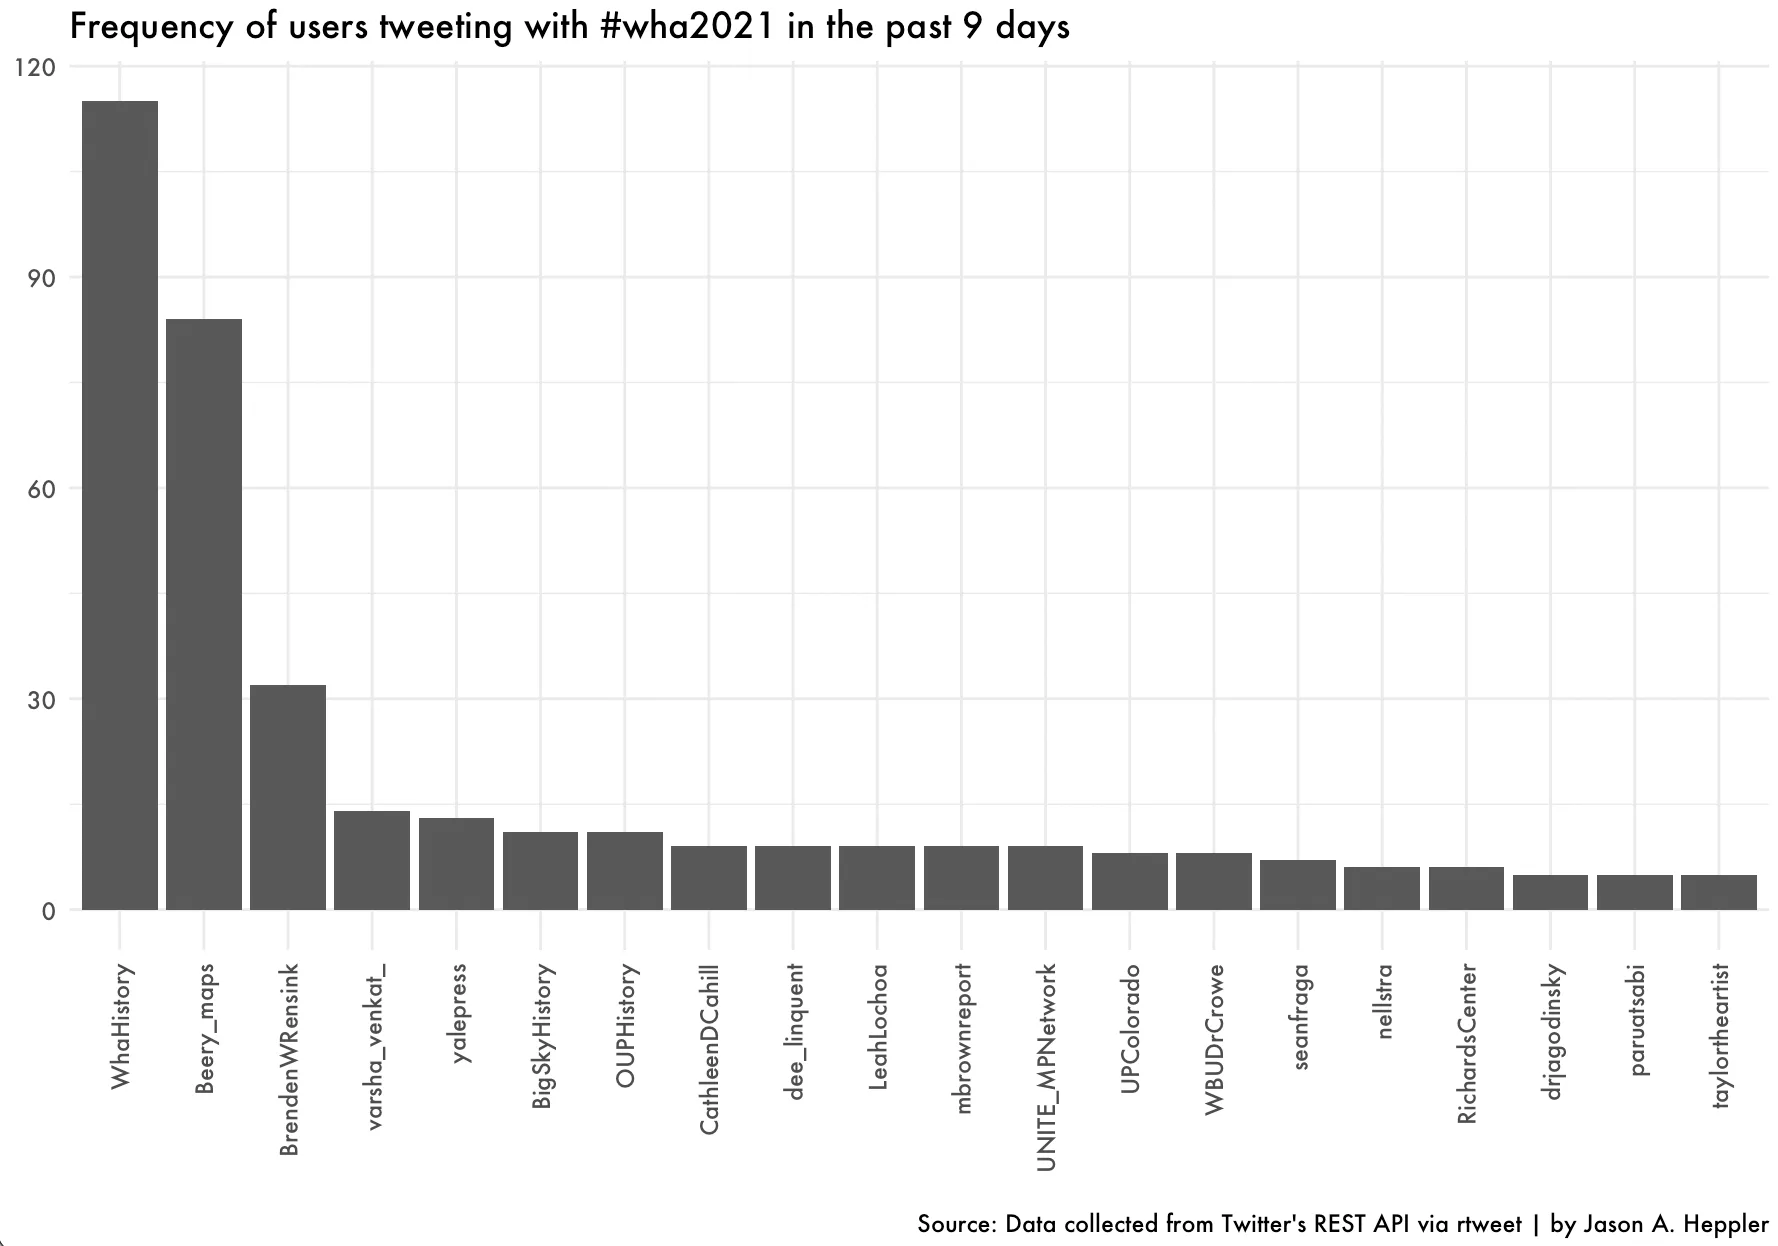
Aggregating the top Twitter users using the #WHA2021 hashtag also lets us see the high volume tweeters. This year, the WHA Offices took the top spot.
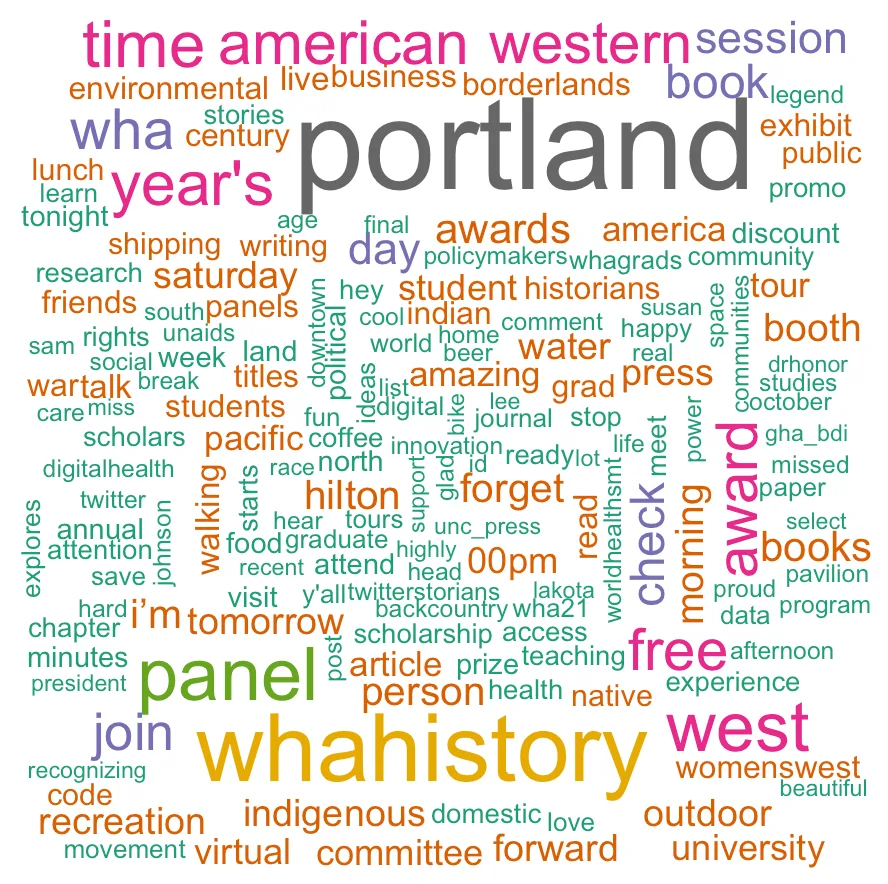
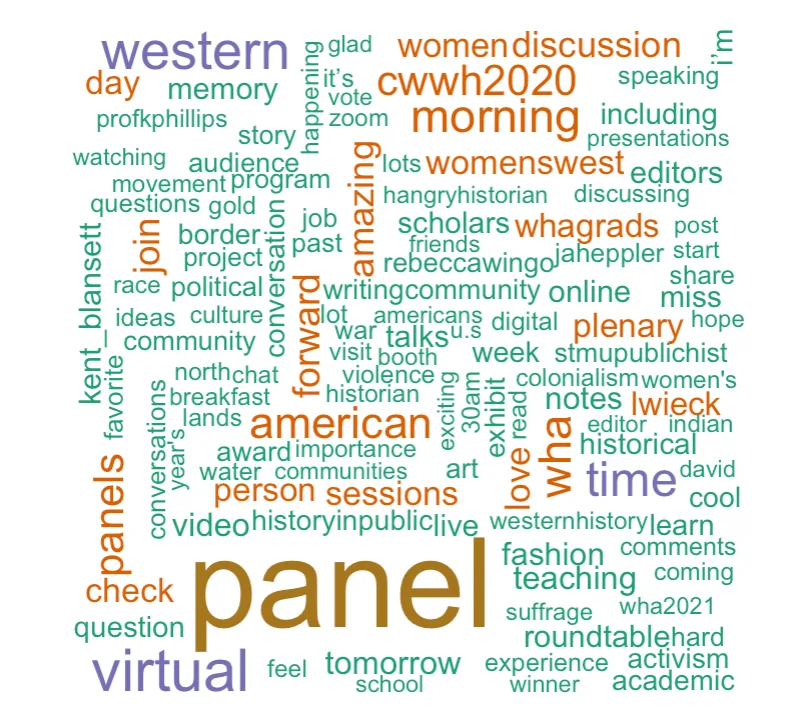
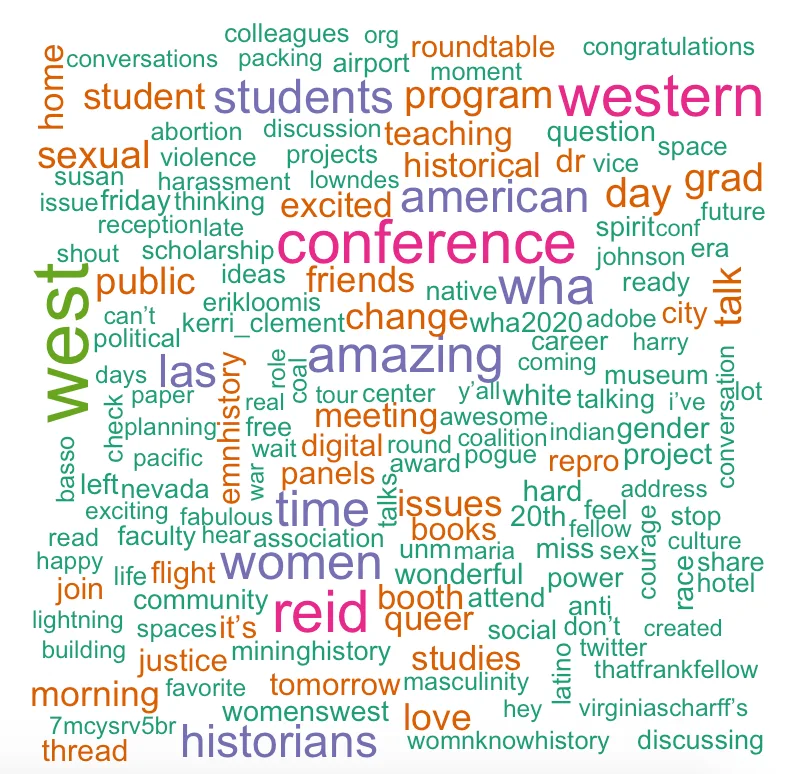
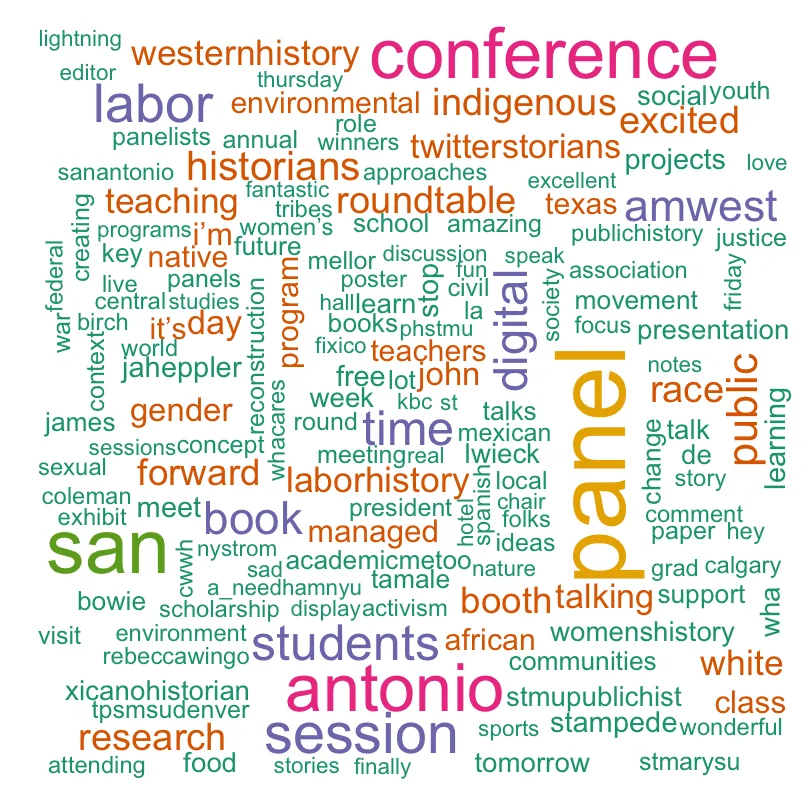
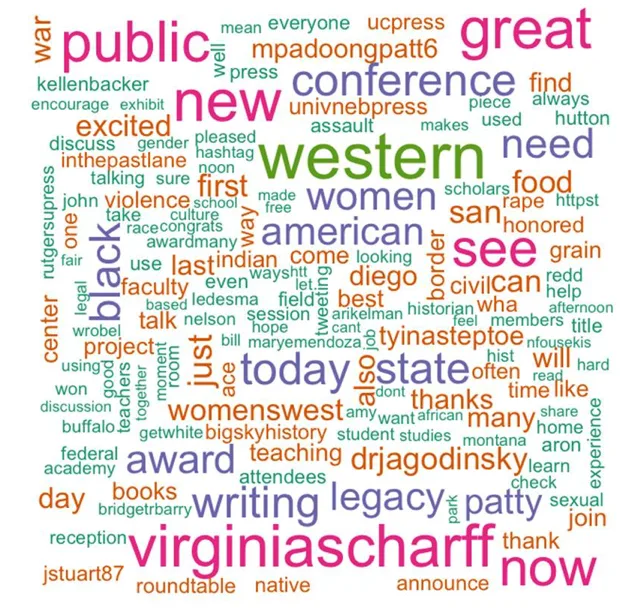
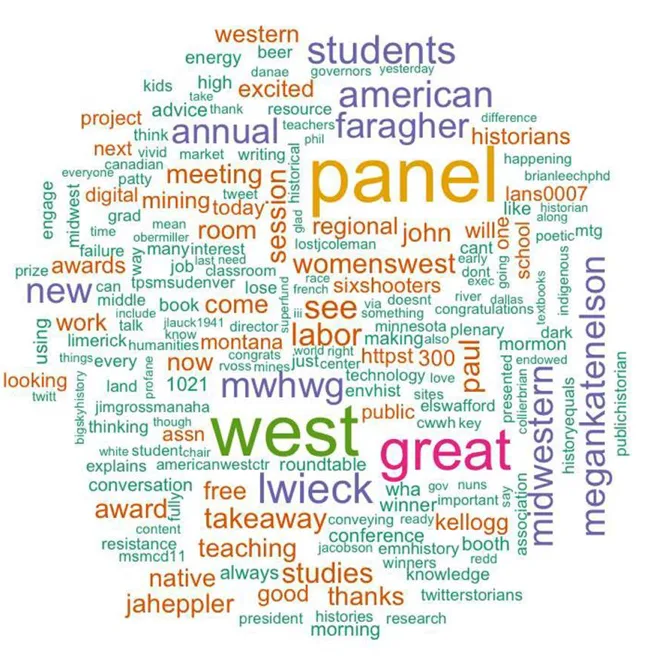
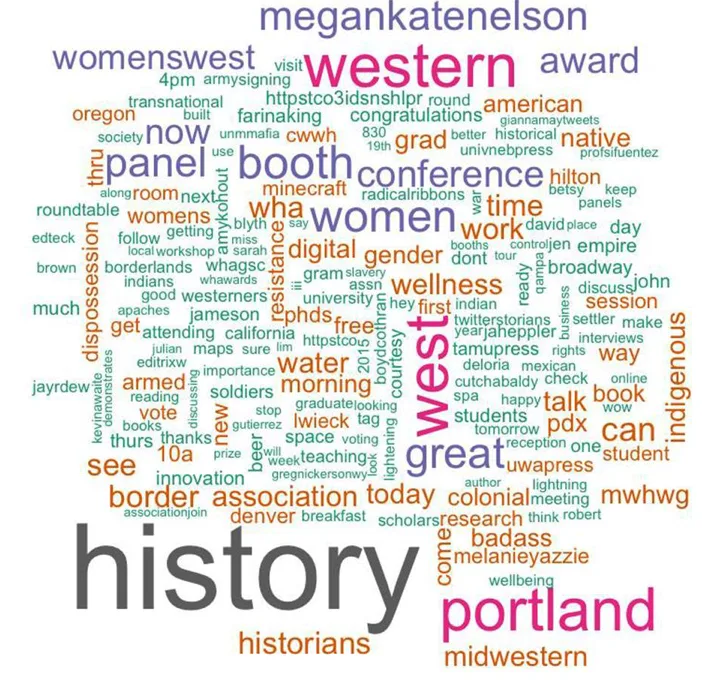
And as I always do, here are the top words used most frequently over the course of the conference. Here’s what we ended up with this year (color and size simply indicate frequency of words) alongside the past conferences I’ve tracked. You can click on these to get a larger image.
Finally, a semantic network to visualize user connections through retweets, quotes, mentions, and replies. Each line indicates a connection between users, and the larger nodes indicate a higher number of connections.
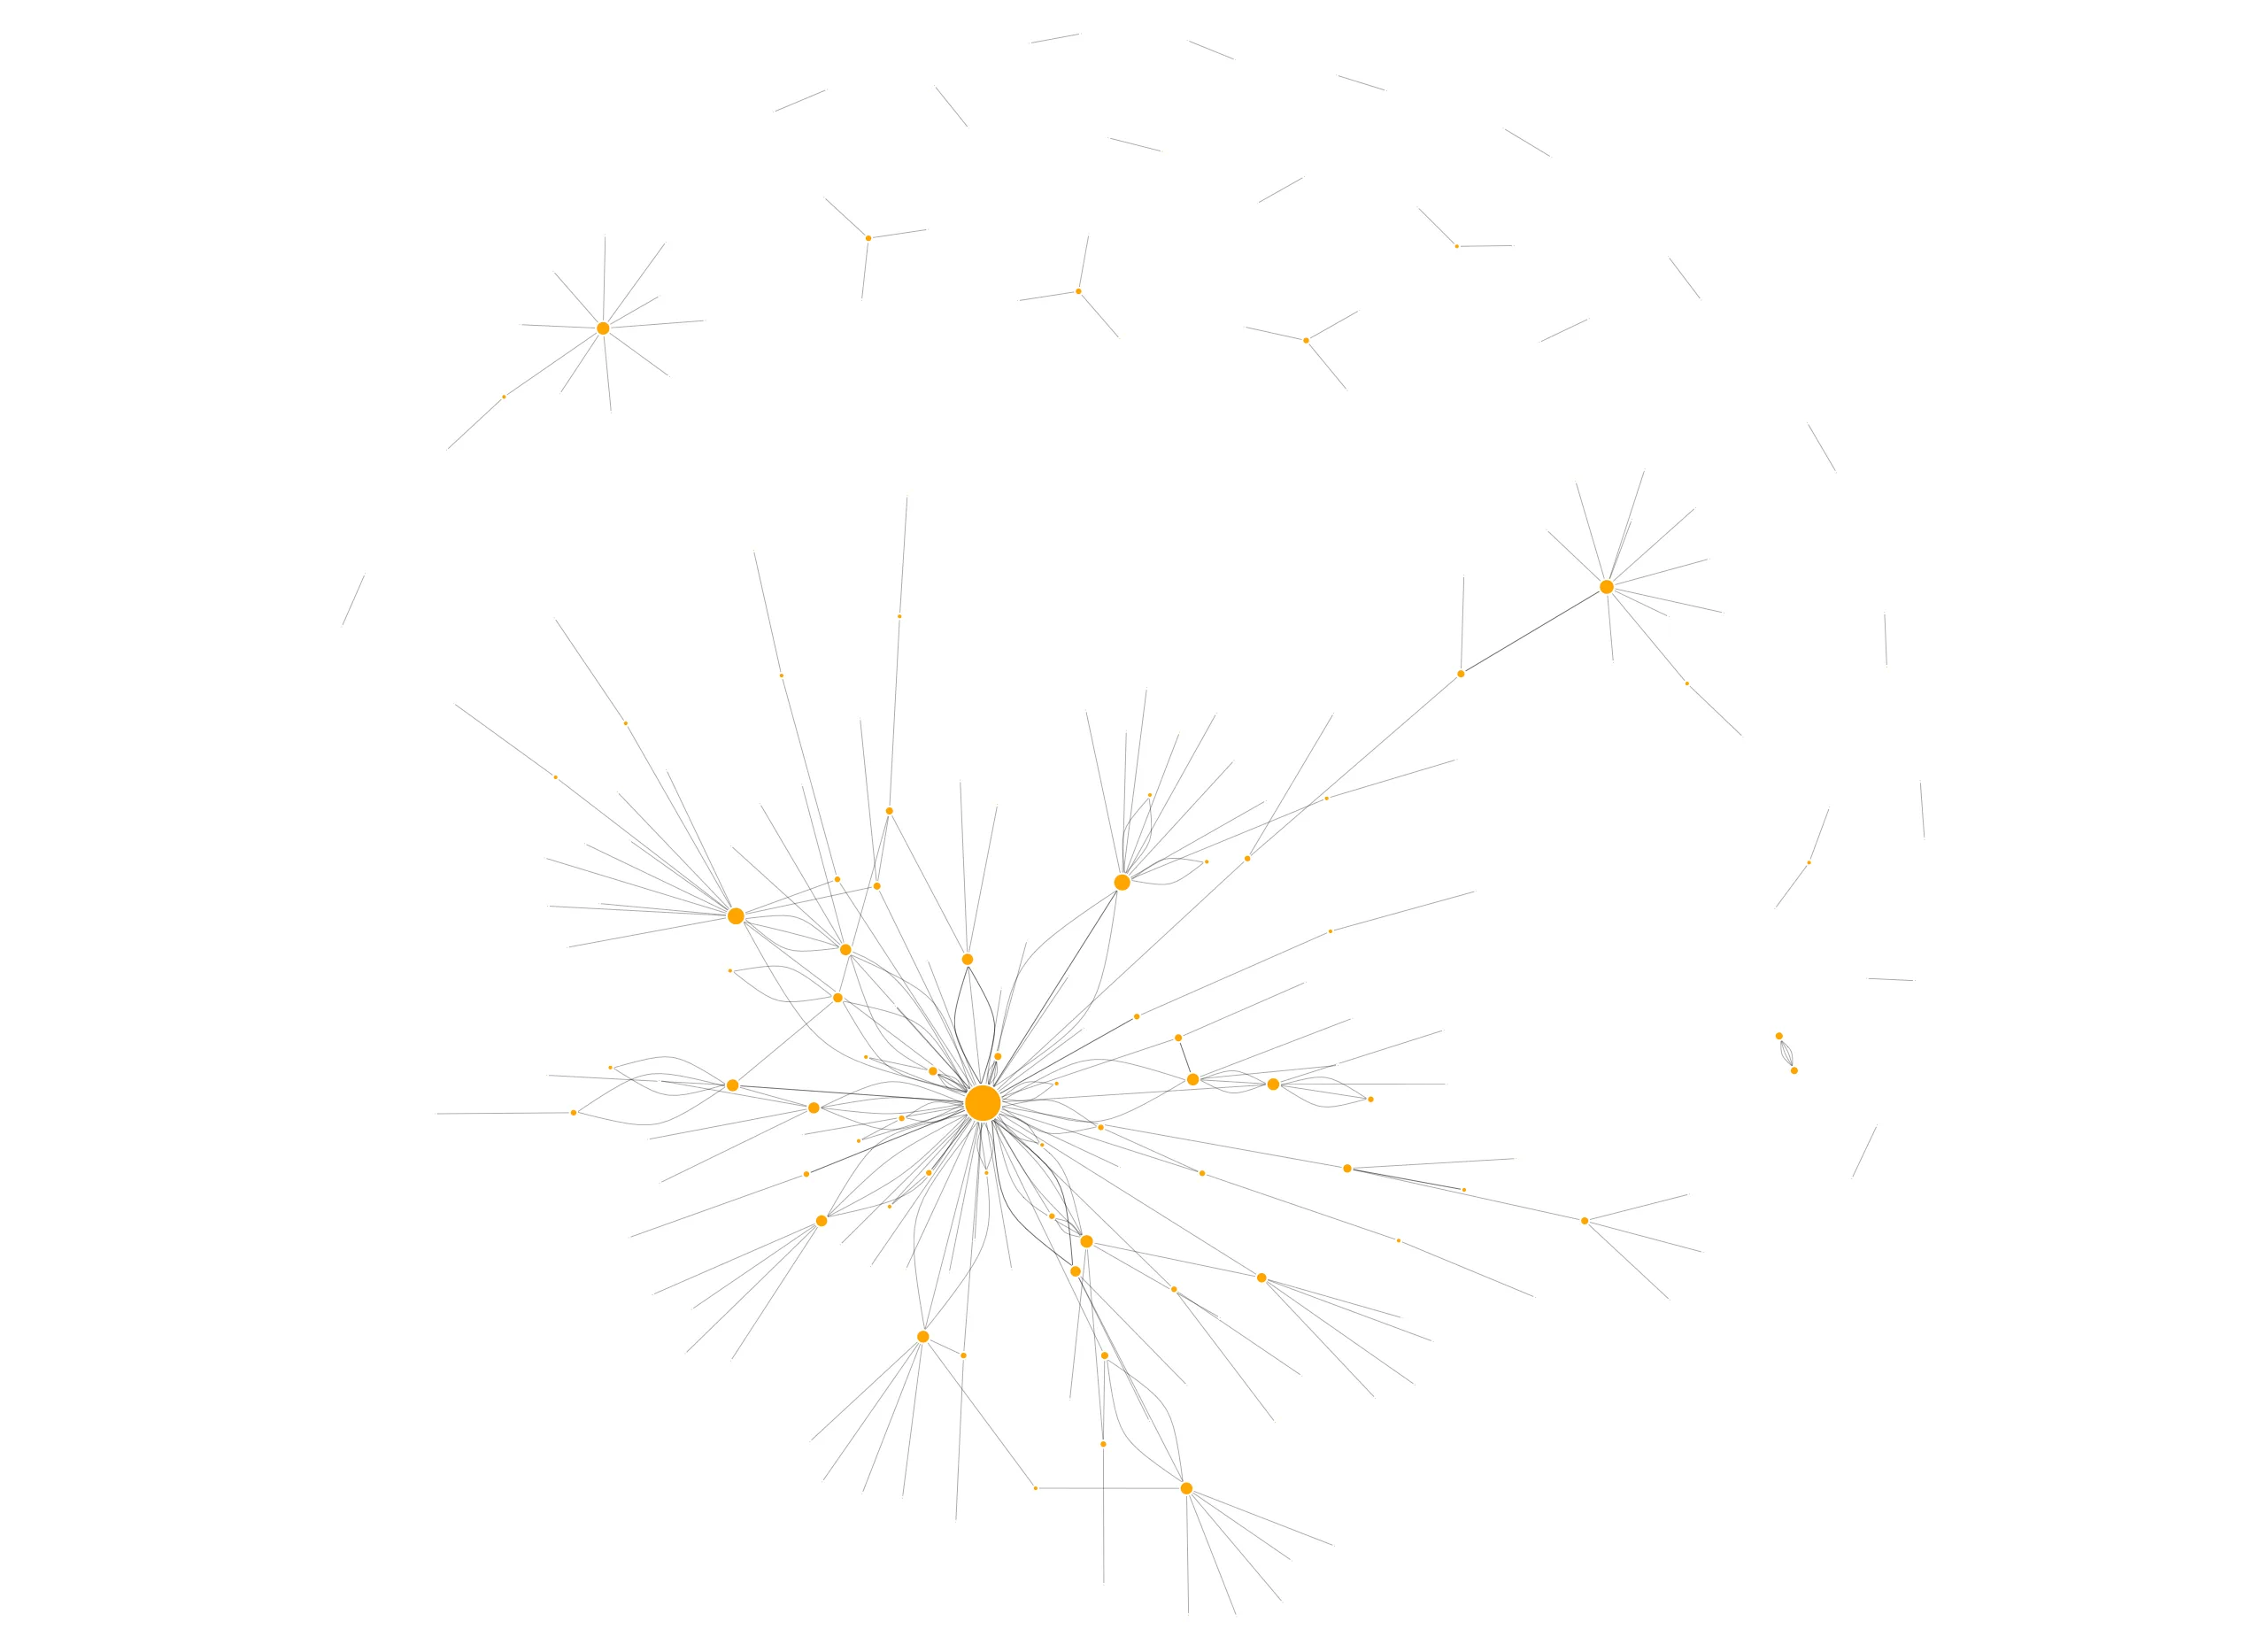
For the interactive version of this network, you can head here.