Every year following the Western History Association’s annual meeting I like to dig into the Twitter usage around the conference. We just wrapped up #WHA2019 and it’s time to dig into the data a bit. Compare this to last year’s data and analysis.
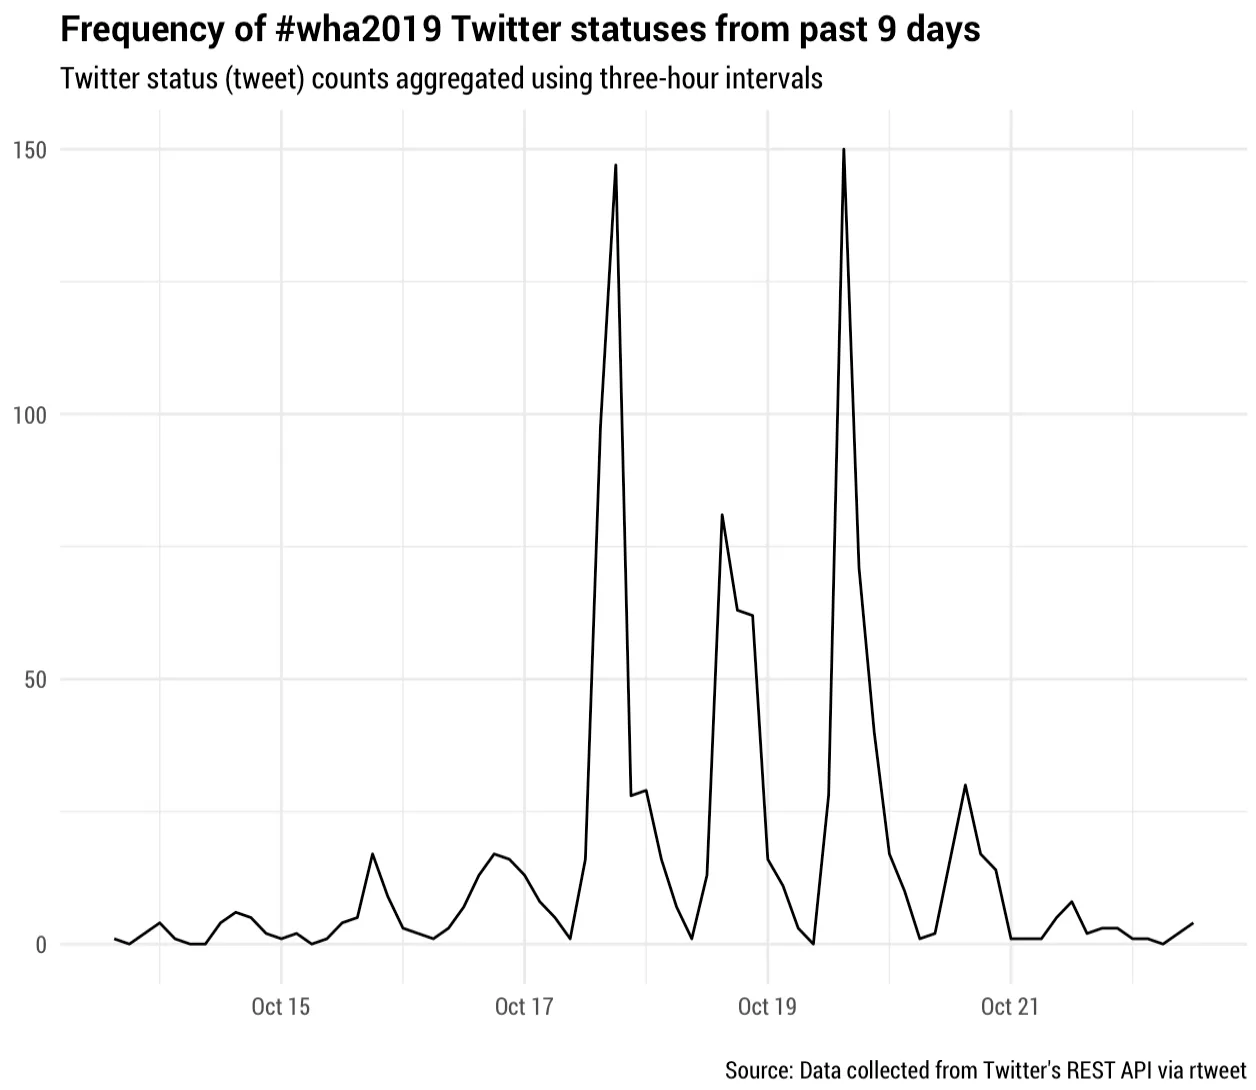
First up, we can chart the frequency of tweets over the past nine days. These are aggregated using three-hour intervals of tweets using the #WHA2019 hashtag. Unsurprisingly, there’s a build-up before the conference before it’s cyclical use thereafter.
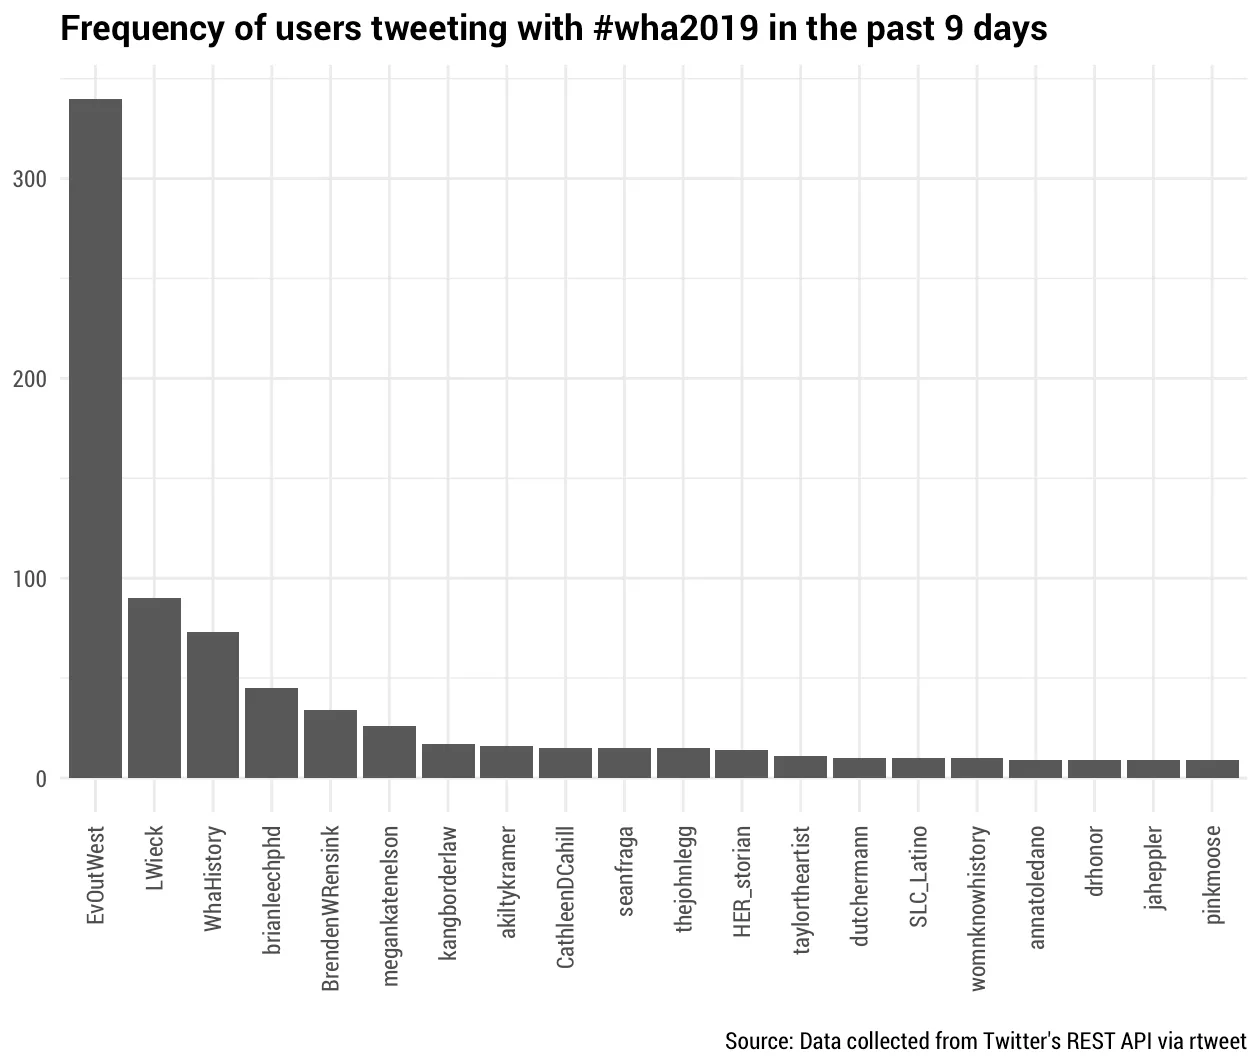
We can also see how the top people tweeting at the conference were in the past nine days. @EvOutWest really ran away with the hashtag usage (fun fact: it was so far above everyone else that I thought it was a bot at first. Sorry, @EvOutWest.) Lindsey, the official WHA account, Brian, Brenden, and Megan led the way in tweeting at the conference.
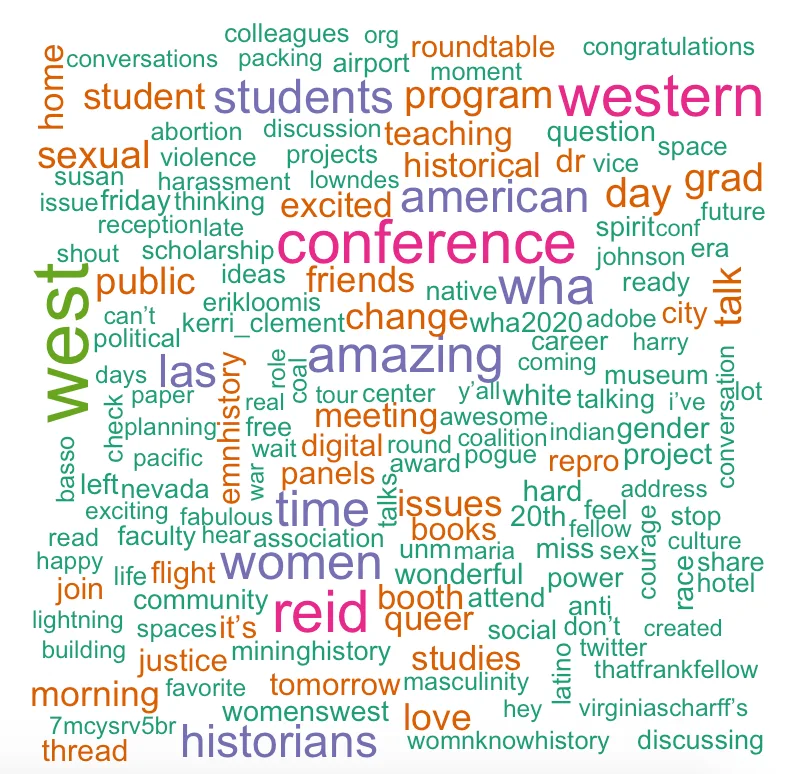
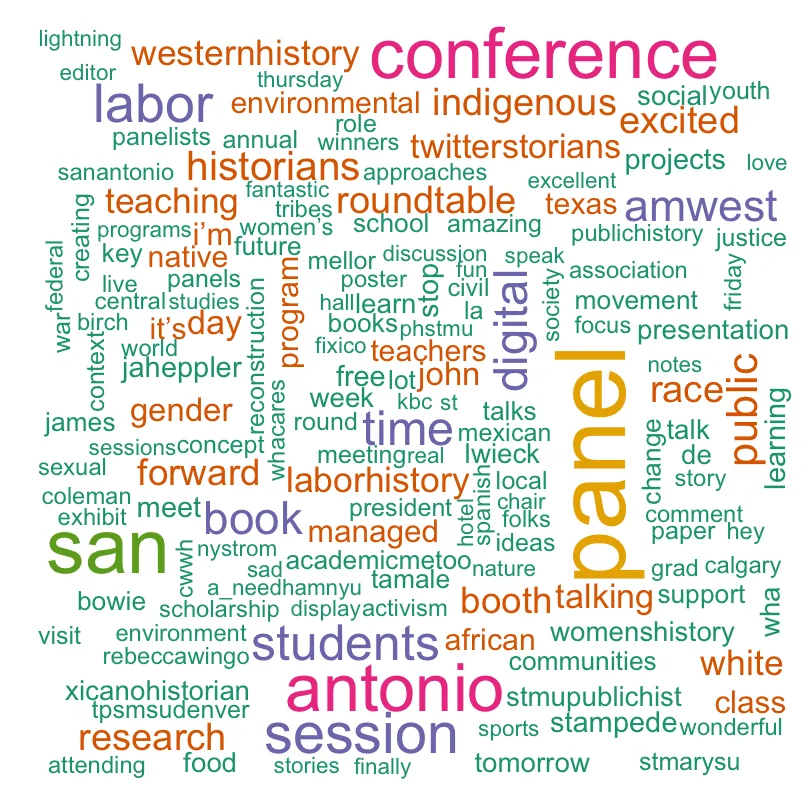
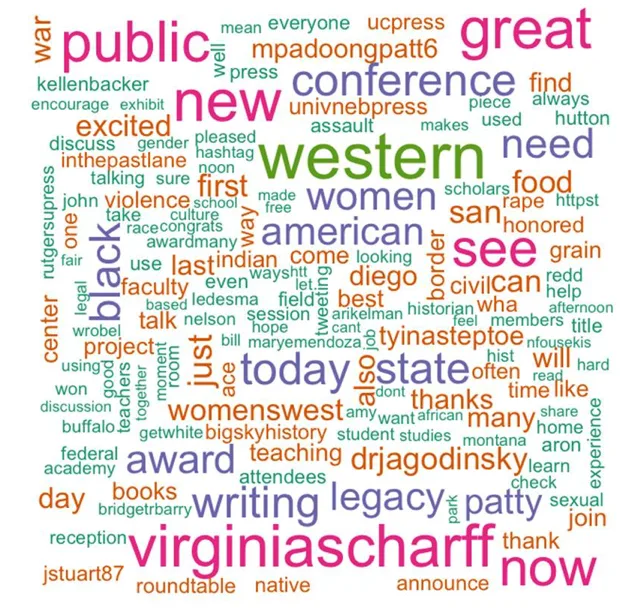
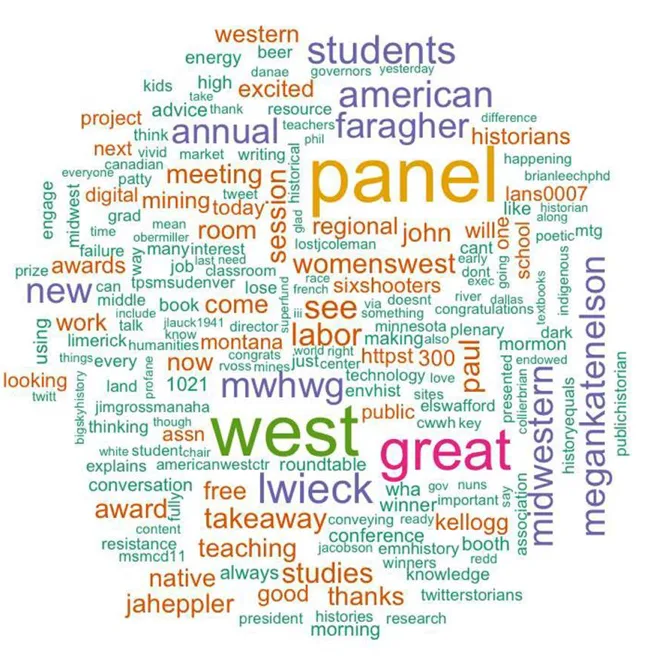
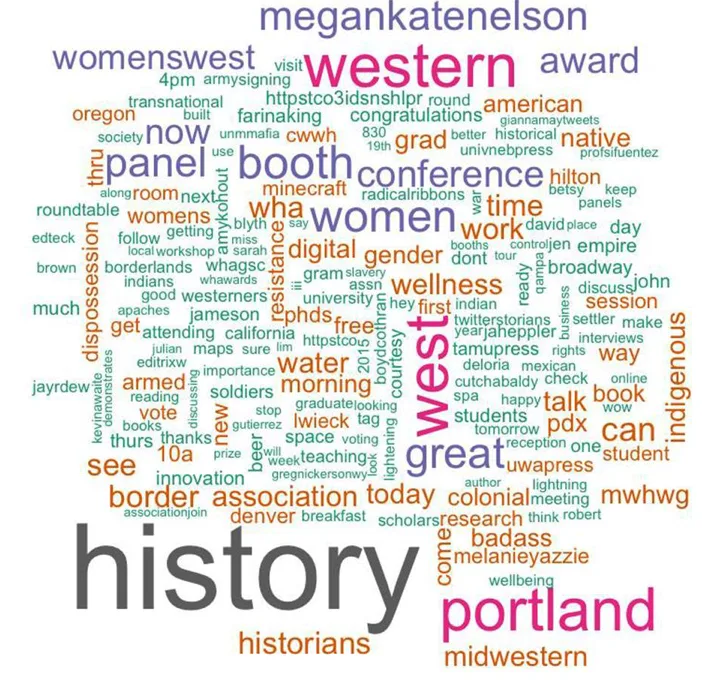
We can also see what words most frequently appeared over the course of the conference. Here’s what we have for this year (color and size simply indicate frequency of words) alongside the past conferences I’ve tracked. Click on any of these to get a larger image.
Finally, a semantic network to visualize user connections via retweets, quotes, mentions, or replies. Each line indicates a connection between users, and the larger nodes indicate a higher number of connections.
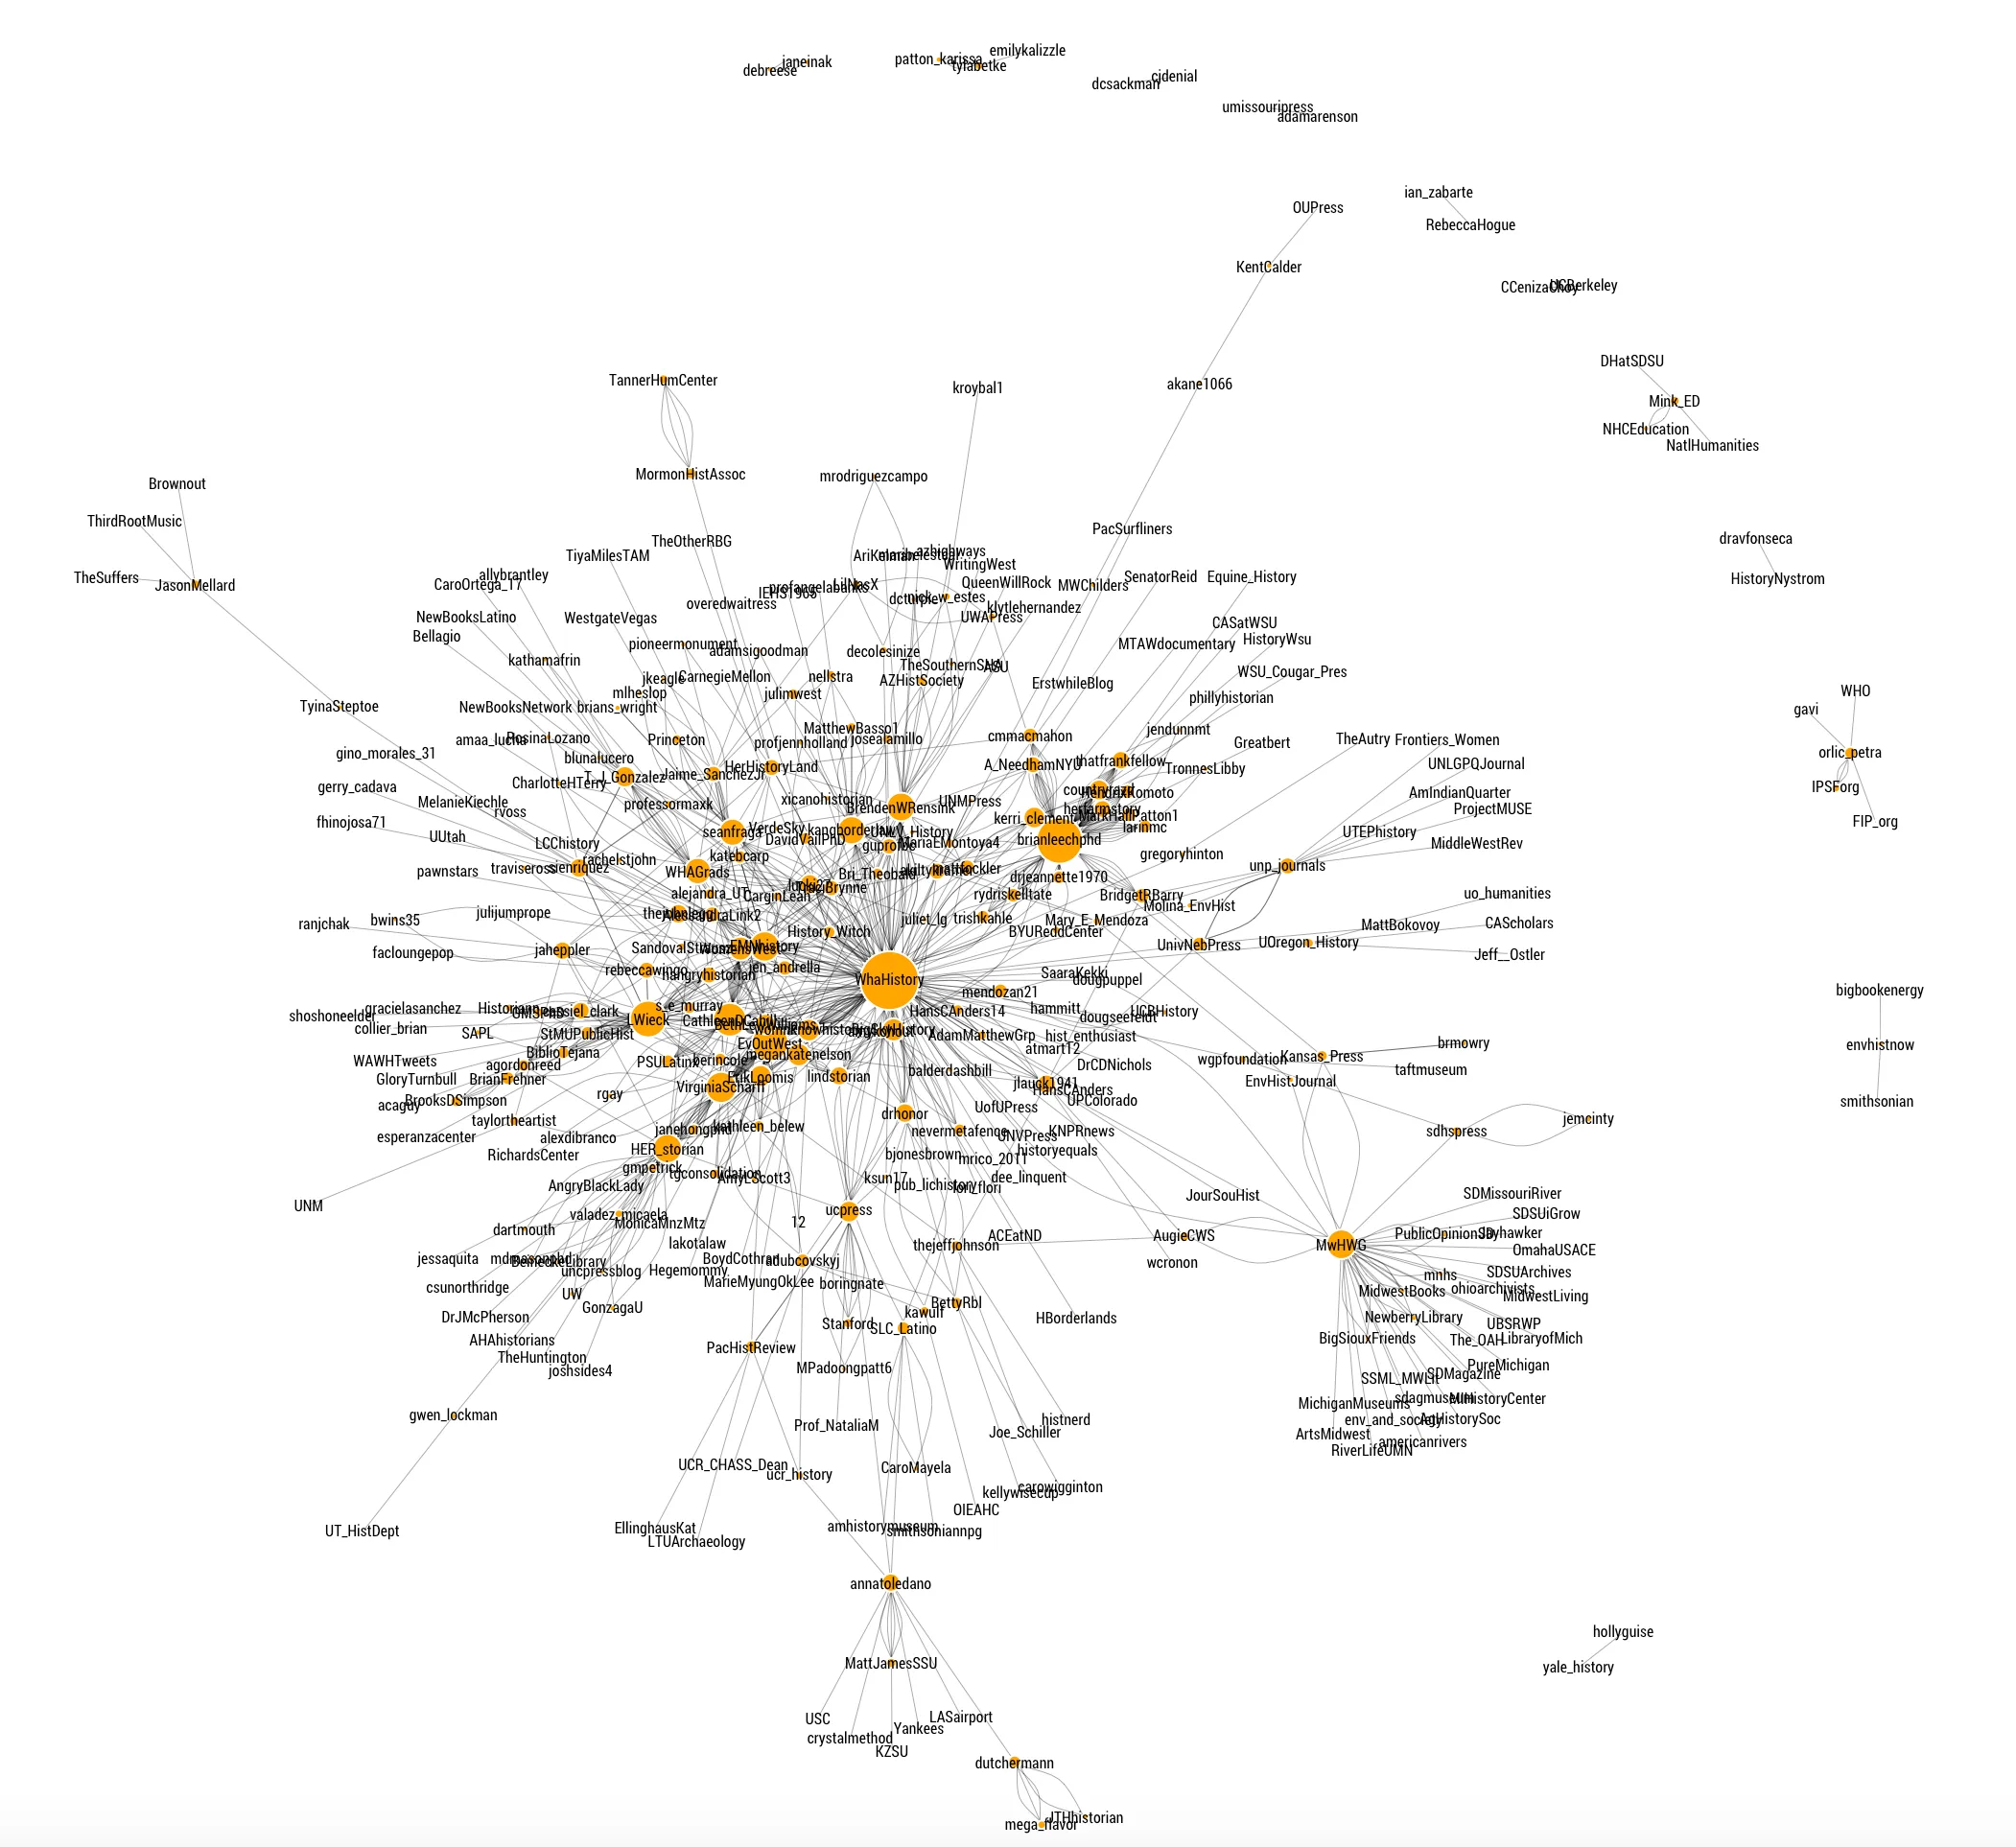
And for the first time ever, I’ve created an interactive version of the network for easier exploration. You’ll have to jump over here to use the interactive version.