For the past few years following the Western History Association’s annual
meeting I’ve been collecting Twitter analytics on users that tweet with the
conference hashtag. We just wrapped up #wha2018 and it’s time to see what’s
in the data. We spent the week in San Antonio, which, strangly enough, was
colder than here in Omaha. Thanks, Texas.
Anyway.
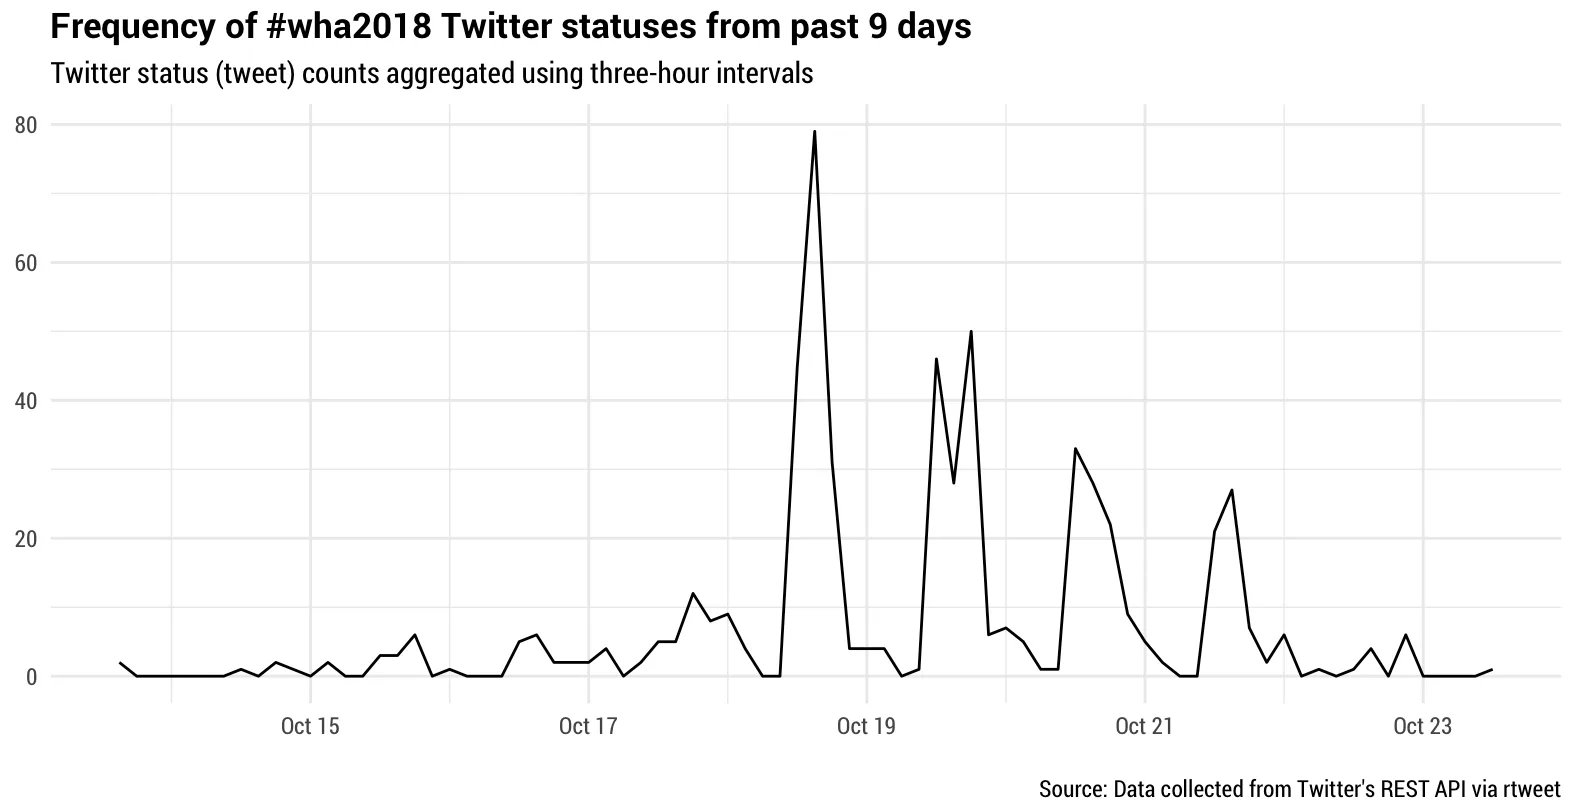
First off, and most simply, we can see the frequency of tweets over the past
nine days. These are aggregated using three-hour intervals about #wha2018
over time. Unsurprisingly, there’s a slight build-up before the conference
began on Thursday and cyclical activity thereafter.
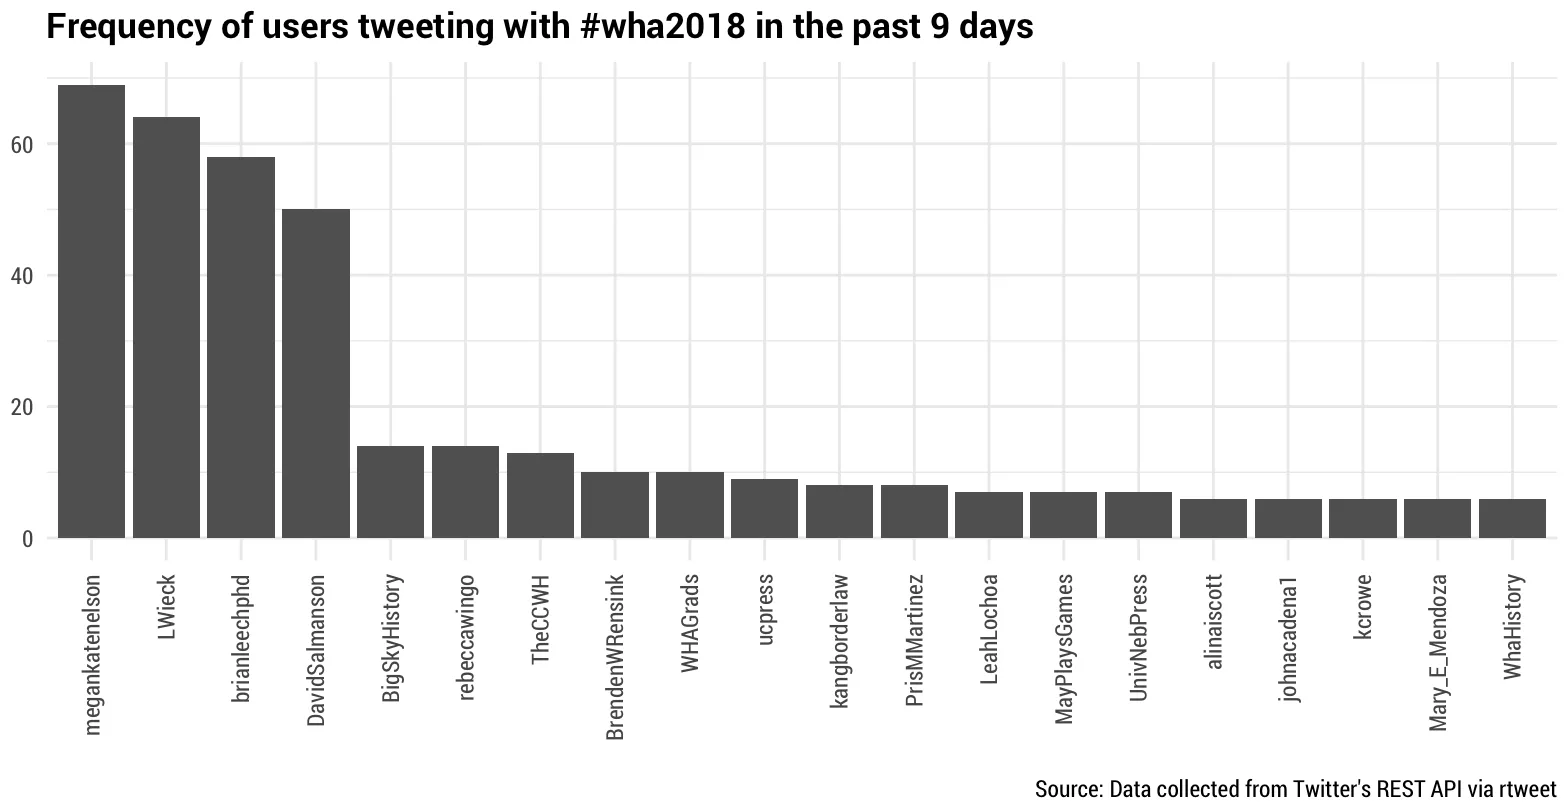
Here are the top people tweeting over the past nine days. Megan just edged out Lindsey. But Megan, Lindsey, Brian, and David substantially led the way in tweets.
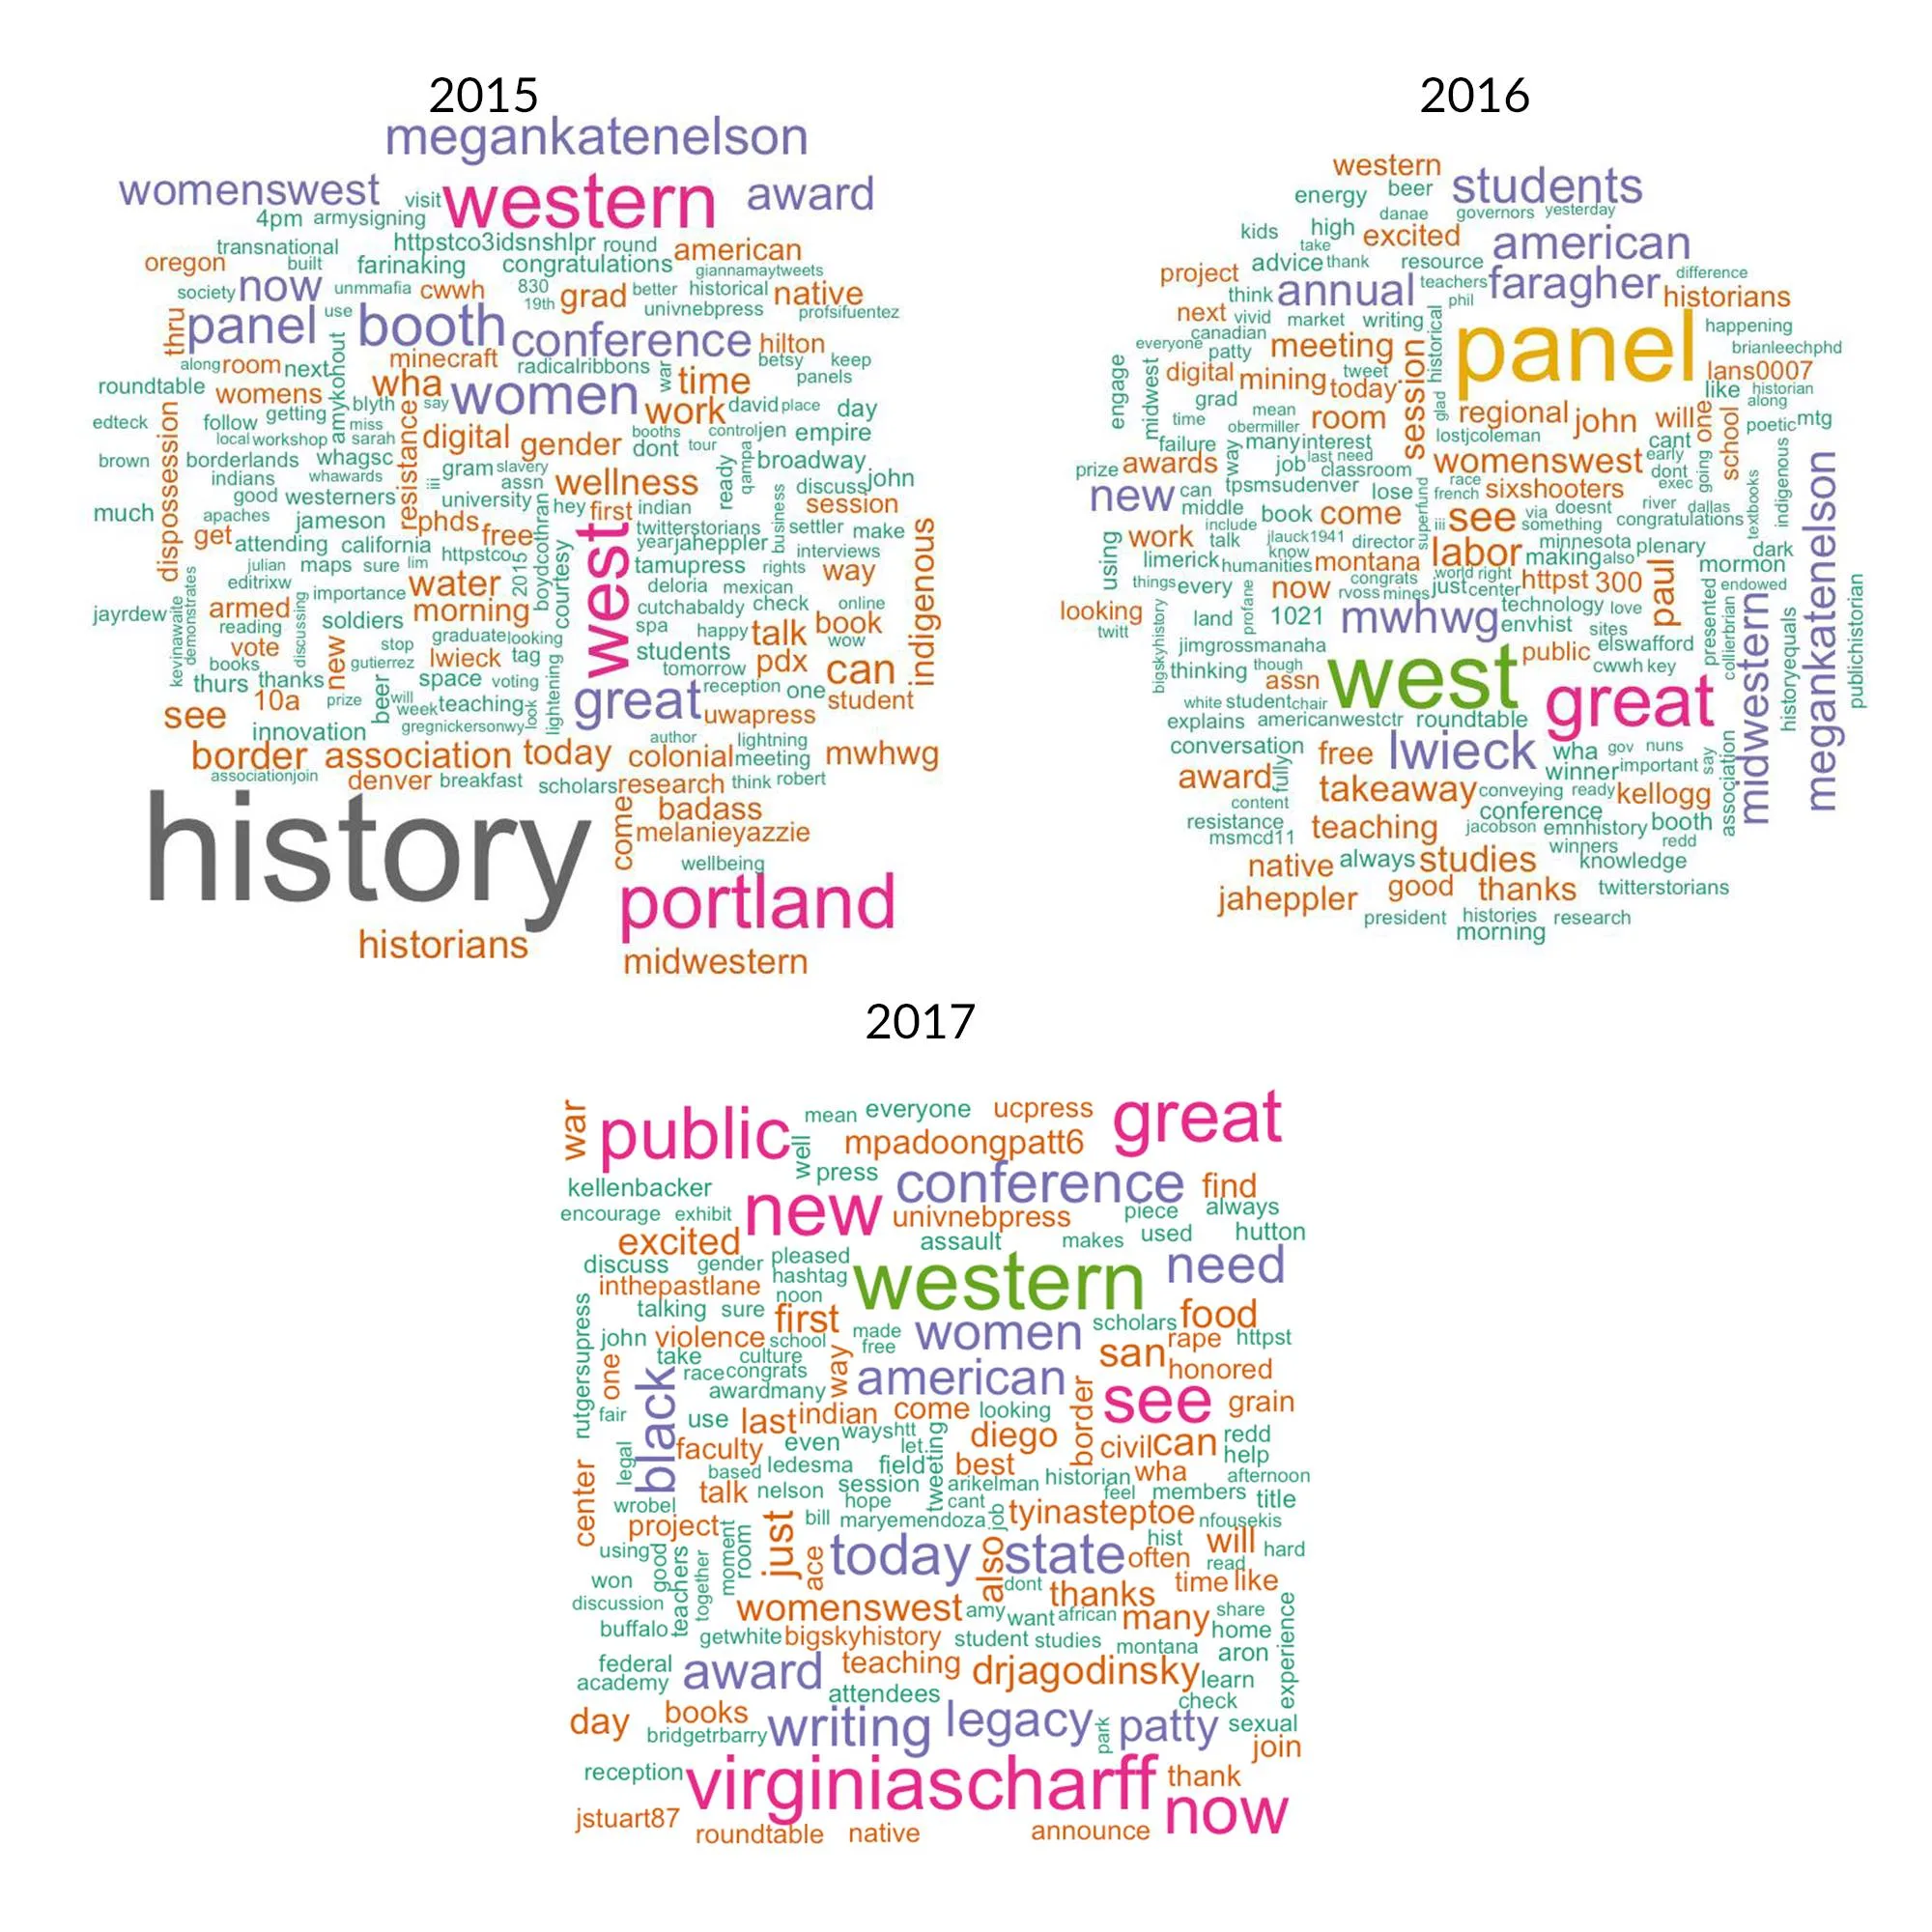
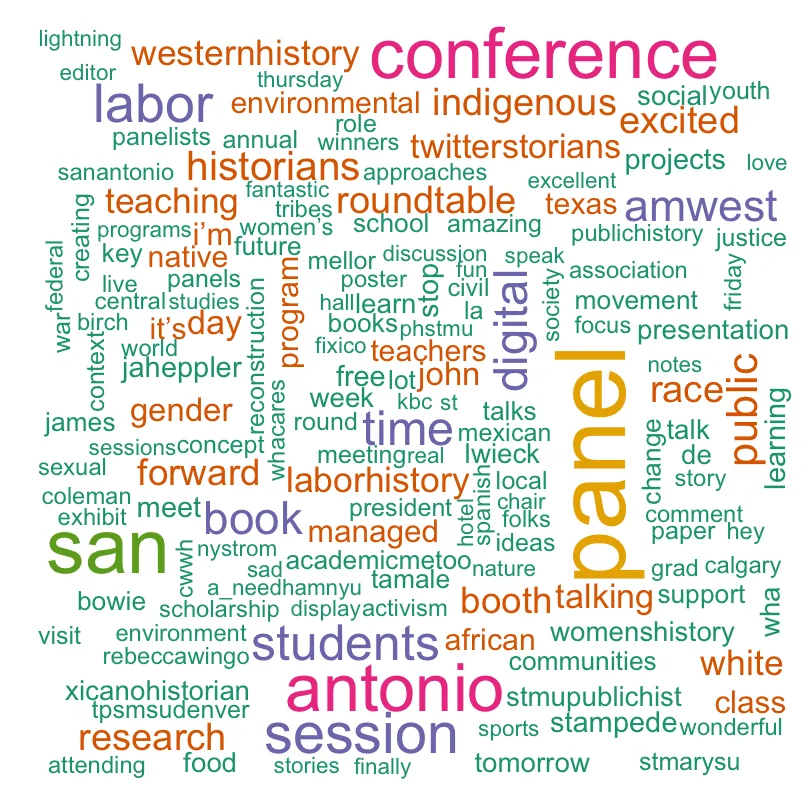
We can also see what words most frequently appeared over the course of the conference. Here’s what we have for this year (color and size simply indicate frequency of words):
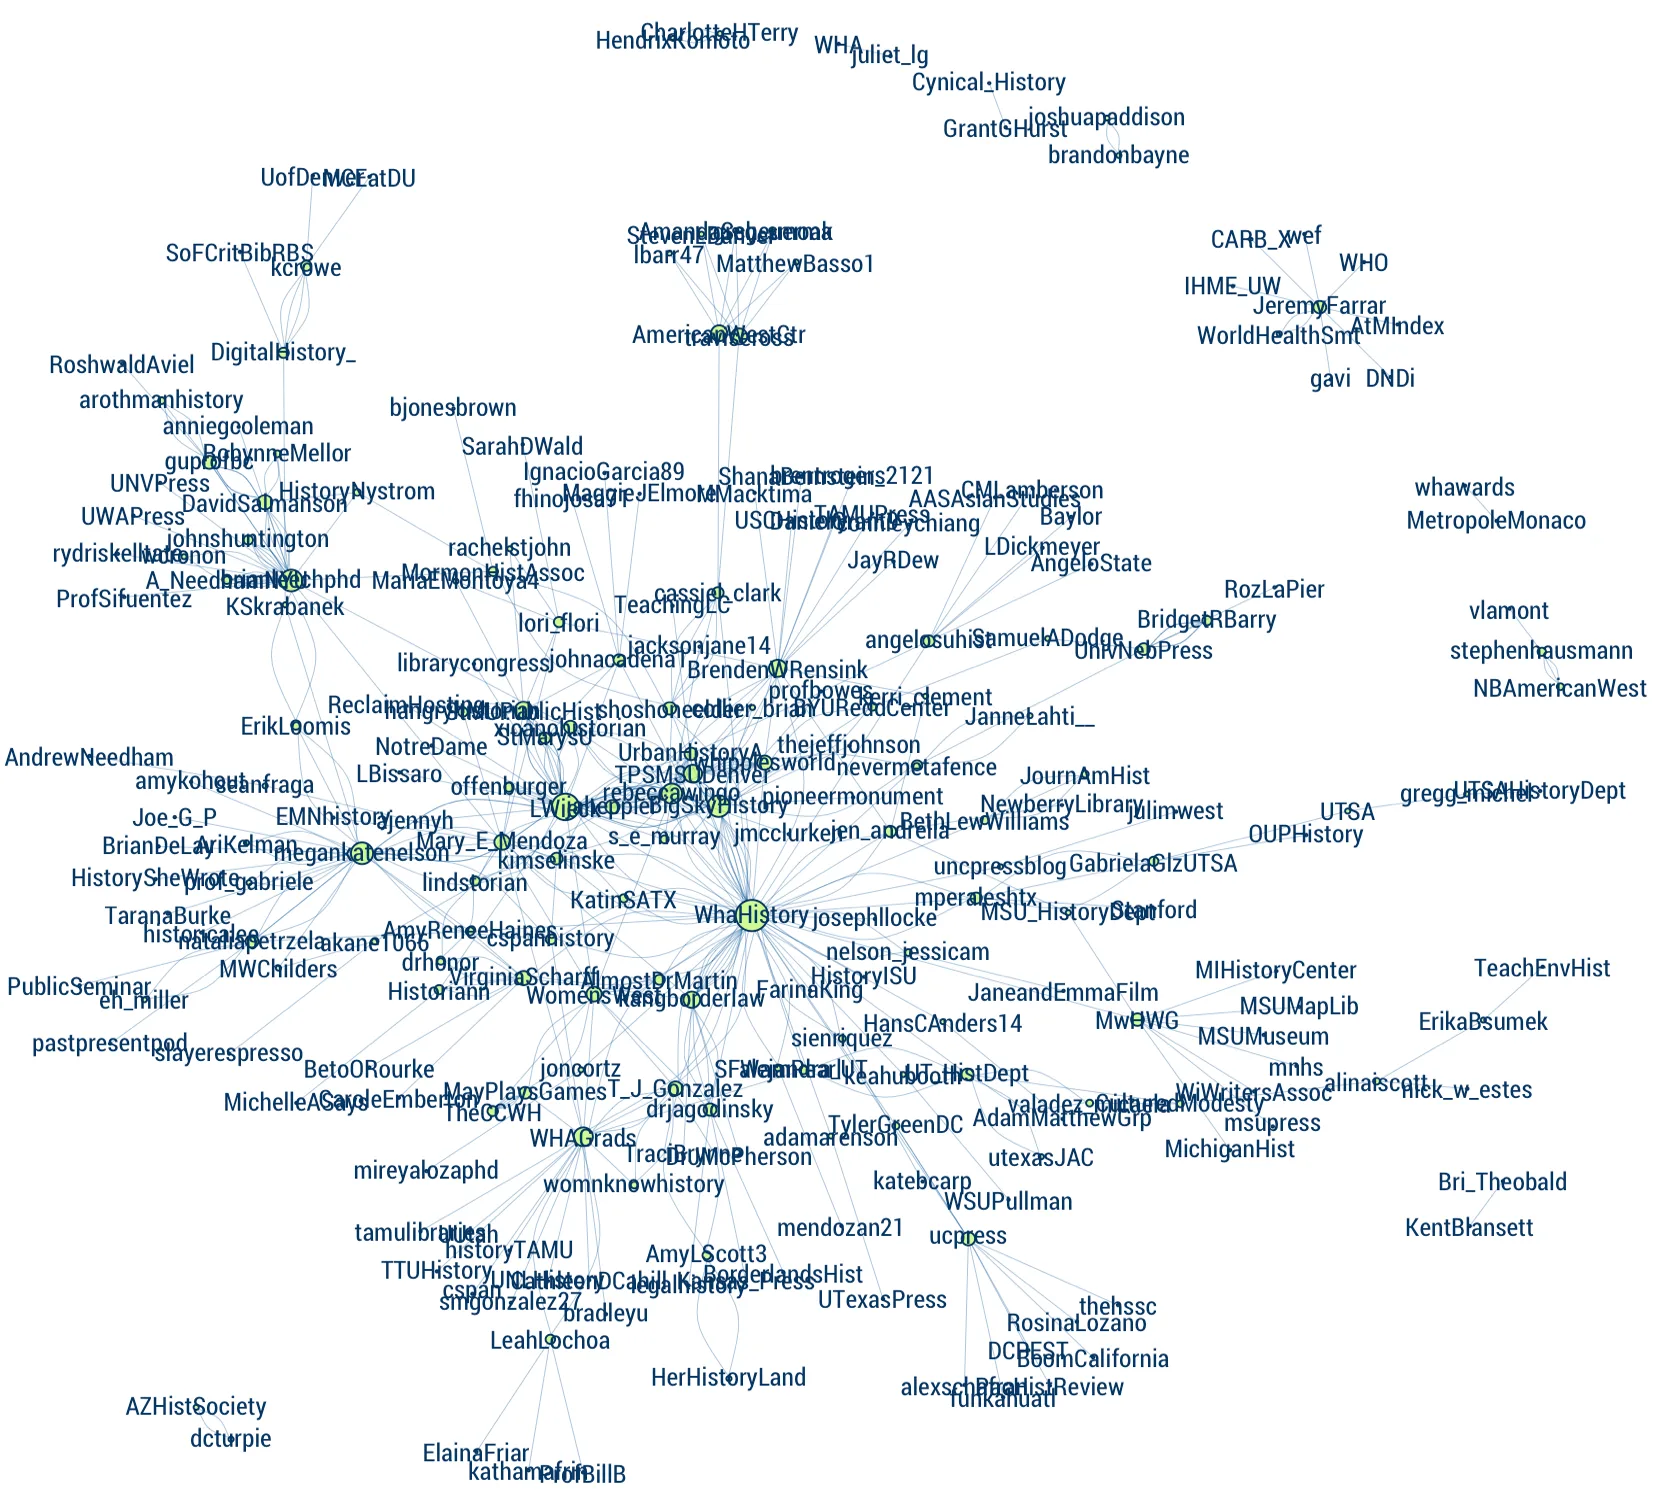
I was also curious about interactions among users, so I created a semantic network to do a quick-and-dirty visualization of user connections via retweets, quotes, mentions, or replies. Each line indicates some kind of semantic connection between users, and the larger nodes indicate a higher number of connections.
And for future reference, here are the word clouds from past WHA conferences I’ve created.